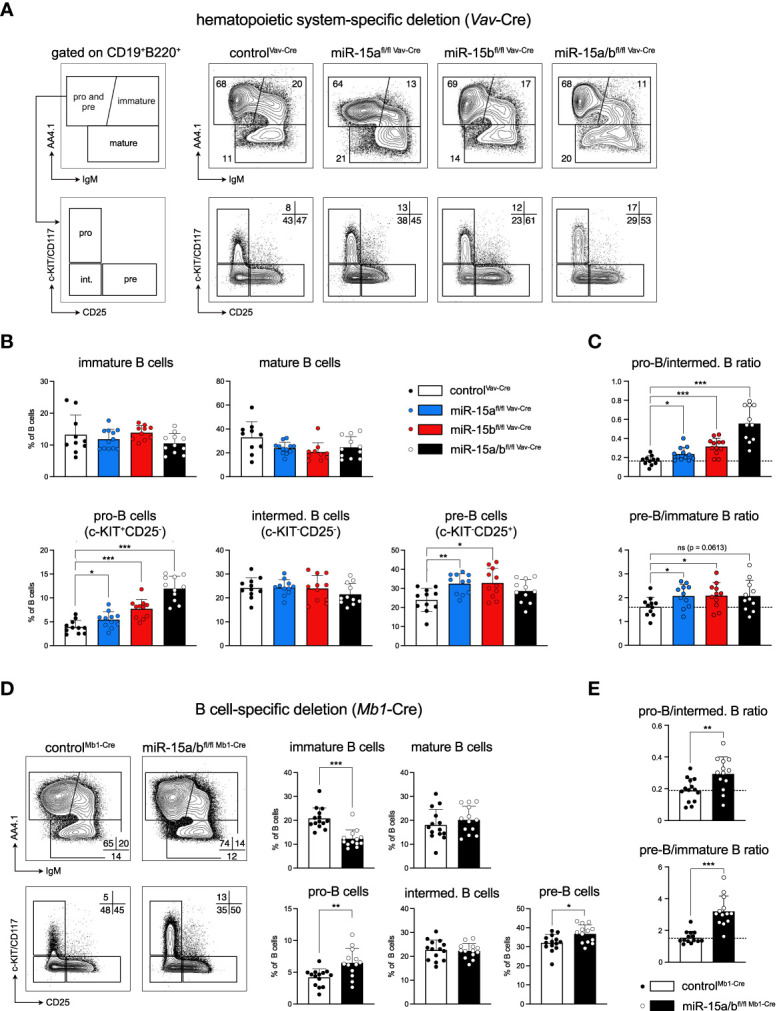
Figure 2.

Loss of the miR-15a/16-1 and miR-15b/16-2 cluster impairs early B cell development. (A) Representative illustration of the gating strategy for pro-B and pre-B (AA4.1+IgM-), immature (AA4.1+IgM+) and mature B cells (AA4.1-) in the bone marrow. Pro-B and pre-B cells were further separated into pro-B (c-KIT+), intermediate B (c-KIT-CD25-) and pre-B cells (CD25+). The panel on the right provides representative FACS plots for all genotypes analyzed here. Numbers indicate the percentage of cells within the respective gate. (B) Bar graphs show the percentage of immature and mature B cells (upper lane) and pro-B, intermediate and pre-B cells (lower lane) within the B220+CD19+ B cell population in the bone marrow of miR-15a/b+/+ Vav-Cre, miR-15afl/fl Vav-Cre, miR-15bfl/fl Vav-Cre and miR-15a/bfl/fl Vav-Cre mice. Each dot represents the data derived from one mouse. (C) Ratio of the relative percentages of pro-B to intermediate B cells as well as pre-B to immature B cells calculated from the data in (B). A dashed line marks the averaged ratio of the controlVav-Cre mice. Each dot represents the data derived from one animal. (D) Representative FACS plots and bar graphs show the percentage of B cell subpopulations in the bone marrow upon B cell-specific deletion (Mb1-Cre) of the miR-15a/16-1 and miR-15b/16-2 clusters. (E). As in C, bar graphs depict the pro-B to intermediate B cell ratio as well as the pre-B to immature B cell ratio for controlMb1-Cre mice and miR-15a/bfl/fl Mb1-Cre mice. A dashed line marks the averaged ratio of the control. Error bars depict the standard deviation of the mean. Each of the different miR-15 knockout groups were statistically compared to control mice by an unpaired two-tailed Student’s t-test. *P < 0.05; **P < 0.005; ***P < 0.0005.
