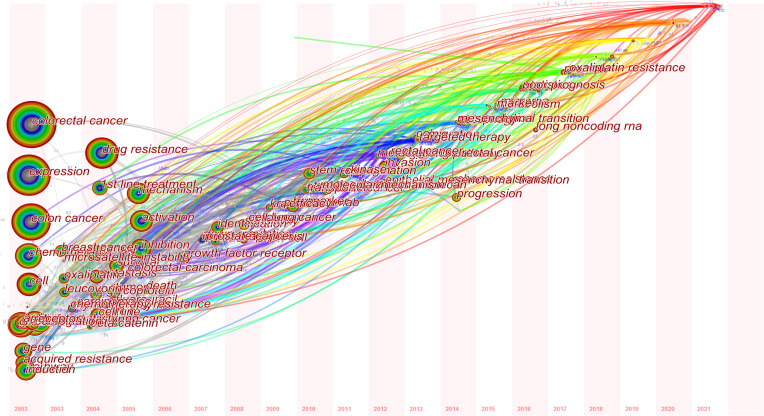
Figure 10.
Time zone view of keywords (co-occurrence rate ≥40) for colorectal cancer drug resistance. The position of the circles on the horizontal axis represents the year in which the keyword first appeared. The size of the circle reflects the frequency of co-occurrence, and the lines between the circles represent the co-occurrence of two keywords.

