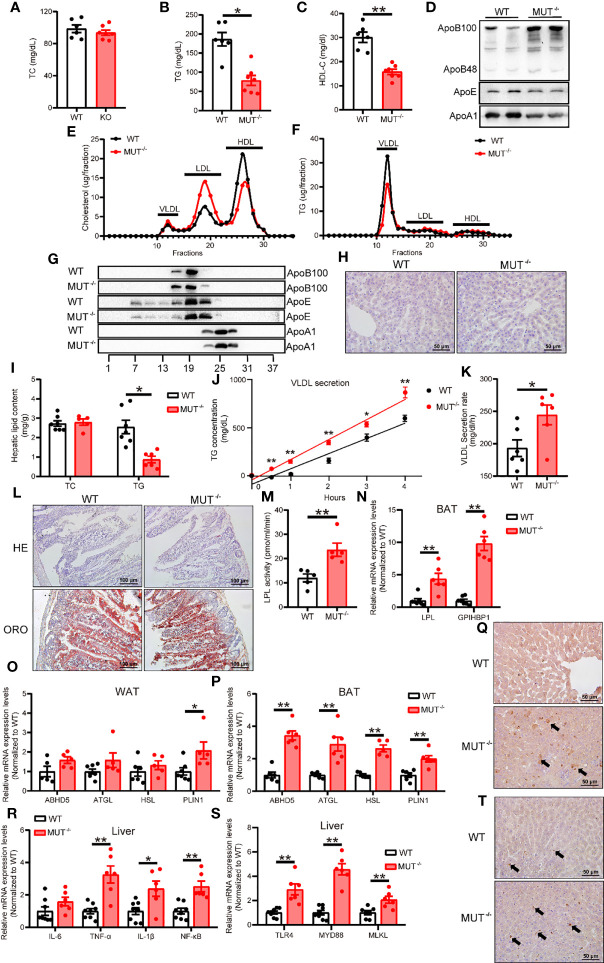
Figure 5.
Chow-fed IL-10MUT/MUT hamsters displayed abnormal lipid metabolism. (A, B and C) Determination of plasma TC (A), TG (B) and HDL-C (C) from 3-month old WT and IL-10MUT/MUT hamsters on chow diet after overnight fasting (n=6~7/group). (D) Representative Western blots of plasma ApoB, ApoE and ApoA1 from WT and IL-10MUT/MUT hamsters. (E, F) Pooled plasma from the two groups were analyzed by FPLC. Triglyceride (E) and cholesterol (F) contents in different fractions of pooled plasma from WT and IL-10MUT/MUT hamsters were measured (n = 6/group). (G) Representative Western blots of ApoB, ApoE and ApoA1 in different fractions of pooled plasma from WT and IL-10MUT/MUT hamsters as described in Figures 5E, F . (H) Cryo-sectionings of liver tissues were stained with oil red O. Bars: 50 μm. (I) Hepatic TC and TG contents were measured and normalized to liver weight (n=6~7/group). (J, K) VLDL secretion was analyzed in hamsters after intraperitoneal injection P-407 (1500 mg/kg, n=6/group). (L) HE and Oil red O stainings of intestinal tissues of WT and IL-10MUT/MUT hamsters 4 h after oral gavage of olive oil (10 ml/kg body weight). (M) Measurement of plasma LPL activities were in WT and IL-10MUT/MUT hamsters. (N) Expression levels of LPL and GPIHBP1 in BAT were determined by real-time PCR (n=5/group). (O, P) Expression levels of genes involved in lipolysis in WAT (O) and BAT (P) were determined by real-time PCR (n=5/group). (Q) Immunohistochemistry of LPS in the liver from WT (top) and IL-10MUT/MUT (bottom) hamsters. Bars: 50 μm; arrows indicate positive staining. (R) Expression levels of TLR4, MYD88 and MLKL in liver were determined by real-time PCR (n=6~7/group). (S) Expression levels of inflammatory factors in liver were determined by real-time PCR (n=6/group). (T) Immunohistochemistry of CD68 in the liver from WT (top) and IL-10MUT/MUT (bottom) hamsters. Bars: 50 μm; arrows indicate positive staining. All date were expressed as means ± SEM, *p<0.05; **p<0.01.

