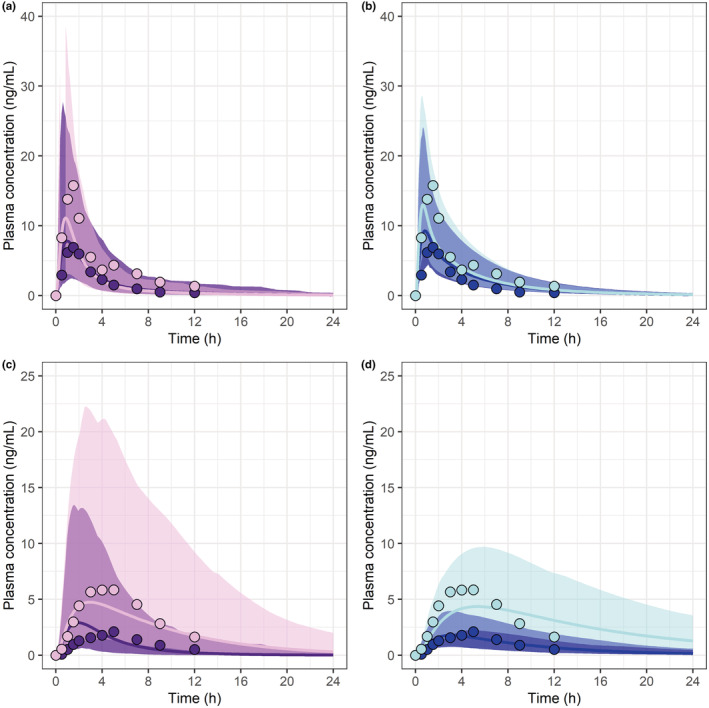
FIGURE 3.

Predicted simvastatin lactone PK profiles (lines) in Simcyp (a) and PK‐Sim (b) versus clinical observations reported as mean (circles) for BCRP CC (dark colors) and AA (light colors) genotypes (31). Predicted simvastatin acid PK profiles (lines) in Simcyp (c) and PK‐Sim (d) versus observed (circles) for OATP1B1 TT and CC genotypes (25). The solid lines represent the predicted geometric mean and the shaded area the predicted 5%–95% quantiles for virtual populations. The normal genotypes (BCRP‐CC and OATP1B1‐TT) are represented with dark colors and the genotypes with reduced function of transporter (BCRP‐AA and OATP1B1‐CC) with light colors. PK, pharmacokinetic.
