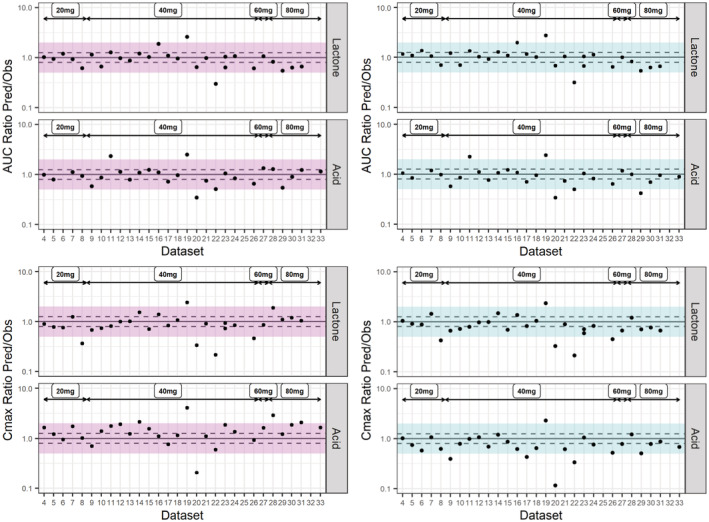
FIGURE 5.

Predicted versus observed simvastatin lactone and acid AUC and Cmax for different datasets at a dose range 20–80 mg (S15–S44). Each study is represented by a dot. The solid line represents the line of unity, the dashed lines represent the 1.25‐fold error and the shaded area represents the twofold error in Simcyp (pink/left) and PK‐Sim (blue/right). AUC, area under the curve; Cmax, maximum plasma concentration; DDI, drug–drug interaction; DGI, drug–gene interaction.
