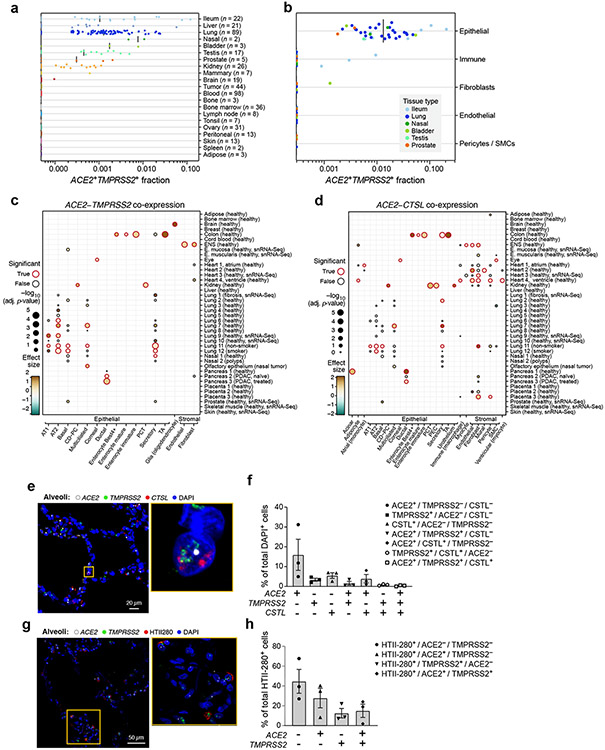
Figure 1. A cross-tissue survey of ACE2+TMPRSS2+ cells shows enrichment in cells at reported sites of disease transmission or pathogenesis.
(a,b) Double positive cells are more prevalent in epithelial organs and cells. (a) Proportion of ACE2+TMPRSS2+ cells (y axis) per dataset (dots) from 21 tissues and organs (rows). (b) Proportion of ACE2+TMPRSS2+ cells (y axis) within cell clusters (dots) annotated by broad cell-type categories (rows) within each of the top 7 enriched datasets (color legend, inset). (c,d) Significant co-expression of ACE2+TMPRSS2+ or ACE2+CTSL+ highlights cells from tissues implicated in transmission or pathogenesis. Significance of co-expression (dot size −log10(adjusted P-value), by two-sided Wald test (Methods); red border: FDR<0.1) of ACE2+TMPRSS2+ (c) or ACE2+CTSL+ (d) and effect size (dot color, color bar) for finely annotated cell classes (columns) from diverse tissues (rows). Only tissues and cells in at least one significant co-expression relationship are shown (Methods). (e-h) In situ validation of double positive cells in the lung, airways, and submucosal gland (n = 3 donors per experiment, imaged three randomly chosen areas per donor). PLISH and immunostaining (e,g) and quantification (error bars: standard error) (f,h) in human adult lung alveoli for (e) ACE2 (white), TMPRSS2 (green) and CTSL (red) (total of 1487 DAPI positive cells examined for quantification (f)) and (g) ACE2 (white), TMPRSS2 (green) and HTII-280 (red) (total of HTII-280 positive 482 cells examined for qualitification (h)).

