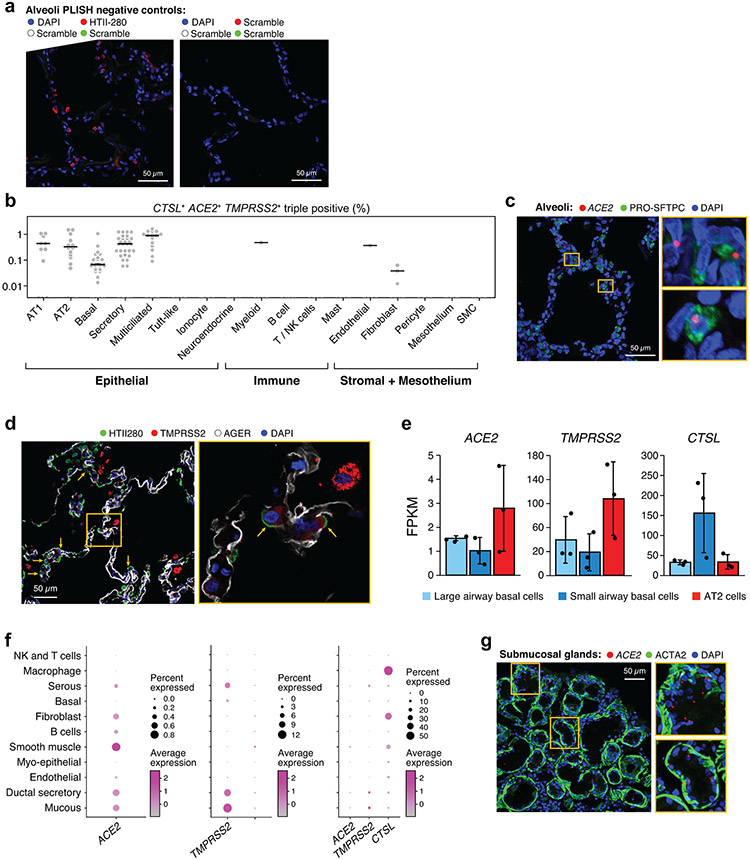
Extended Data Fig. 7. ACE2, TMPRSS2, CTSL Immunofluorescence and RNA profiling.
(a) Negative control of PLISH in human lung alveoli. Left shows scrambled probe detection in three indicated colors. Right shows HTII-280 antibody staining (red) with 2 color scramble probe detection. DAPI (blue) indicates nuclei. (b) Frequency of ACE2, CTLS and TMPRSS2 triple positive cells in each sample (n = 60) (dots) in the Regev/Rajagopal dataset. (c) PLISH and immunostaining in human adult lung alveoli for ACE2 (red), PRO-SFTPC (green), DAPI (blue).
(d) Immunostaining in human adult lung alveoli. HTII-280 (green) , TMPRSS2 (red) and AGER (white). Blue shows DAPI in nuclei. (e) Mean expression (y axis, FPKM, from bulk RNA-seq, error bars: standard error) of ACE2, CTSL, TMPRSS2 in sorted cells from 3 different human explant donors using the following markers: large and small airway basal cells (NGFR+), AT2 cells (HT-II 280+) and alveolar organoids (HT-II 280+). (f) Expression in the submucosal gland. Mean expression (color) and proportion of expressing cells (dot size) of ACE2, TMPRSS2 and CTSL in key cell types (rows), from scRNA-seq of human large airway submucosal glands. (g) PLISH and immunostaining in human large airway submucosal glands. ACE2 (red), ACTA2 (green) and DAPI (blue). We imaged one representative area for a single patient for a,c,d,g (Methods).

