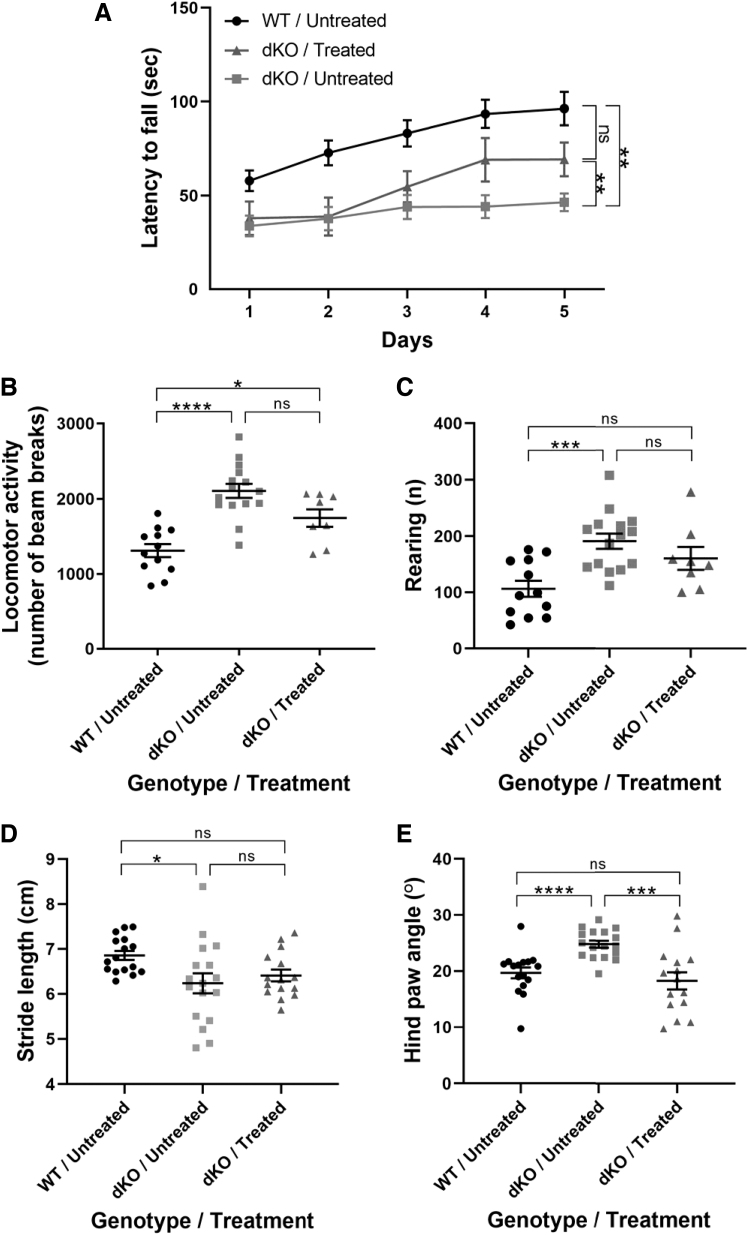
FIG. 2.
Locomotor performance is improved in dKO mice treated at P30. (A) Locomotor deficiencies were monitored by a rotarod test. Data were analyzed with mixed model regression with random intercept and the fixed factors of time, group, and the interaction term of group with time. To compare learning curves between groups, the β coefficients were compared. WT untreated mice (n = 16), treated dKO mice (n = 13), untreated dKO mice (n = 24). Open field tests included (B) horizontal locomotion and (C) vertical rearing. (D, E) Paw print assessment at P120 to determine (D) stride length and for (B–D) one-way ANOVA with Tukey's multiple comparisons was used. (E) Hind paw angle. For (E), Mann-Whitney non-parametric test for independent samples was used. The data are presented as mean, and error bars represent SEM. (*p < 0.05, **p < 0.01, ***p < 0.001, ****p < 0.0001). WT, wild type.

