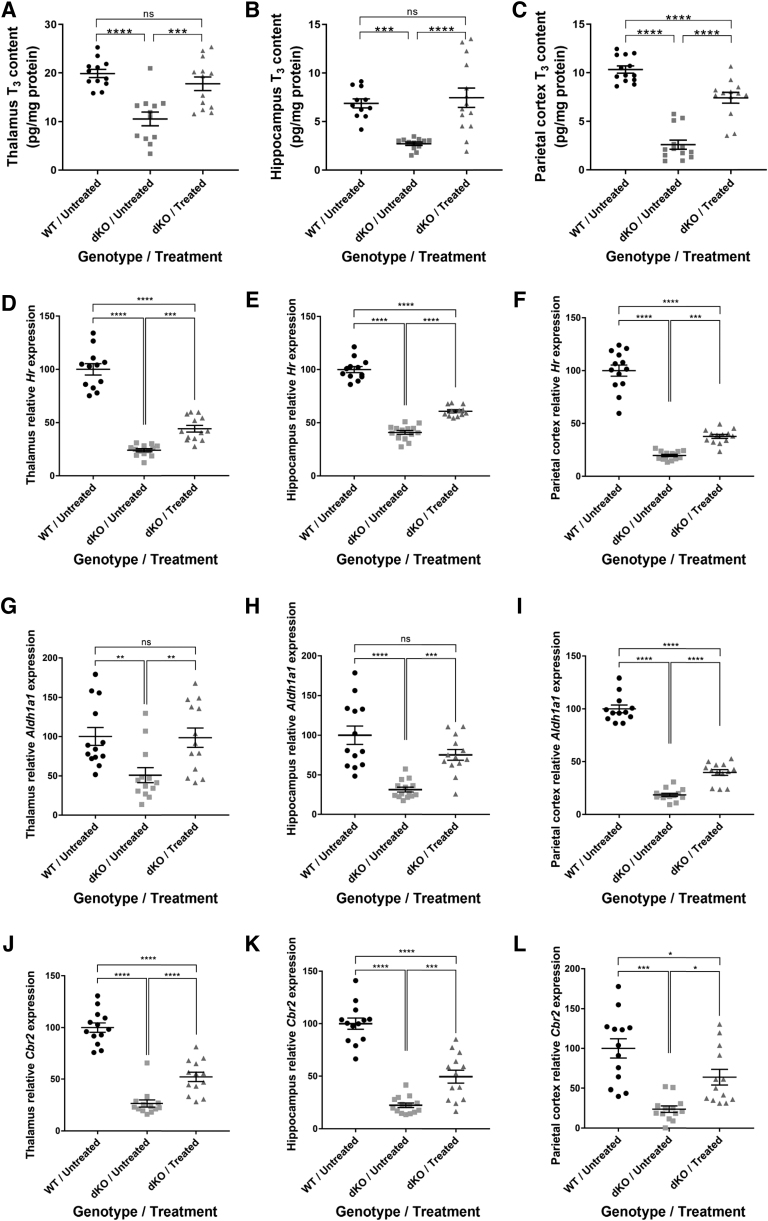
FIG. 4.
Brain T3 content and T3-induced gene expression in dKO mice treated at P30. T3 content measured in the (A) thalamus (B), hippocampus, and (C) parietal cortex. T3-induced genes were examined by qRT-PCR. Hr expression was measured in the (D) thalamus, (E) hippocampus, and (F) parietal cortex. Expression of Aldh1a1 was measured in the (G) thalamus, (H) hippocampus, and (I) parietal cortex. Expression of Cbr2 was measured in the (J) thalamus, (K) hippocampus, and (L) parietal cortex. The data are presented as mean, and error bars represent SEM. For (C, G, J), Mann-Whitney non-parametric test for independent samples was used. For (A, B, D–F, H, I, K, L), one-way ANOVA with Tukey's multiple comparisons was used. The data are presented as mean, and error bars represent SEM. (*p < 0.05, **p < 0.01, ***p < 0.001, ****p < 0.0001). Aldh1a1, aldehyde dehydrogenase 1 family member a1; Cbr2, carbonyl reductase 2; Hr, hairless; T3, triiodothyronine.

