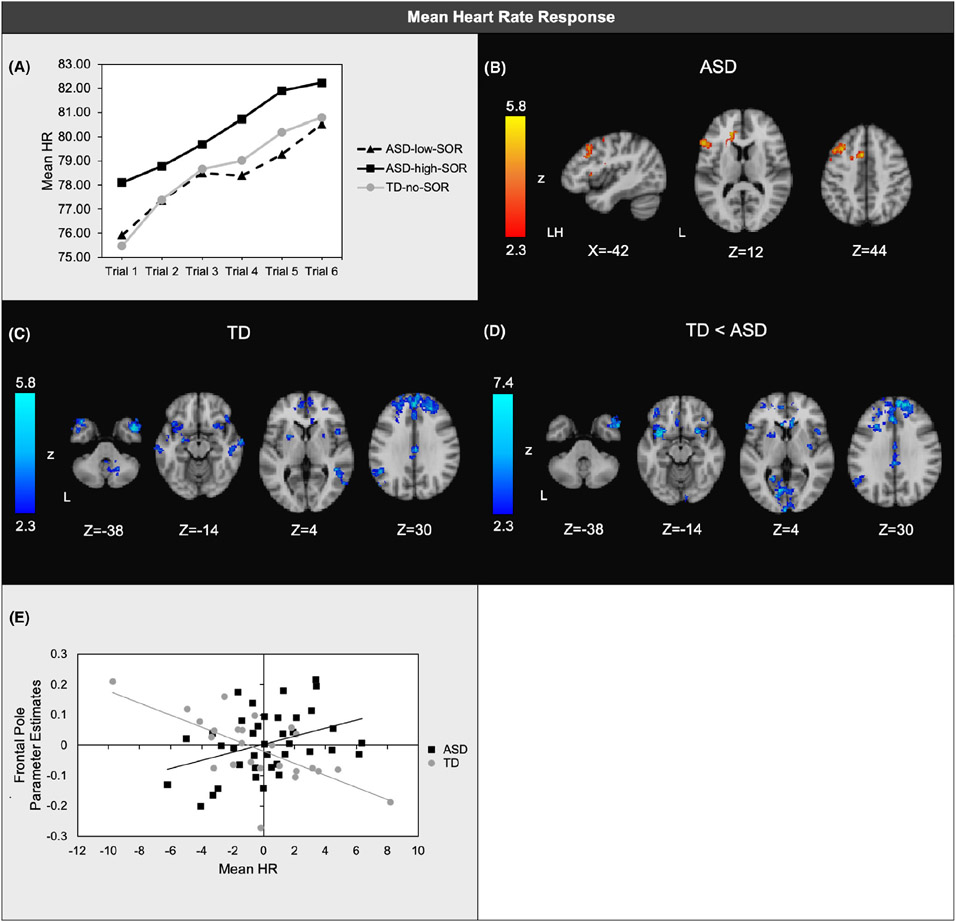
Figure 2.
(a) Mean heart rate (HR) responses averaged across joint, tactile, and auditory trials; (b) Regions where brain responses to aversive sensory stimulation were positively associated with mean HR within ASD; (c) Regions where brain responses were positively associated with mean HR within TD; (d) Regions of significant diagnostic group differences in associations between HR and brain responses; (e) Scatterplot illustrating a representative correlation between mean HR and brain responses in each group. Horizontal axis: unstandardized residuals of mean HR. Vertical axis: parameter estimates extracted from areas of frontal pole shown to have significant ASD vs. TD group differences in the correlation between brain responses and HR orienting slopes. Two potential outliers were noted in the TD group; correlations within all clusters remained significant after removal of these outliers with the exception of left temporal pole and left angular gyrus (Table S2). All analyses covaried for baseline HR baseline

