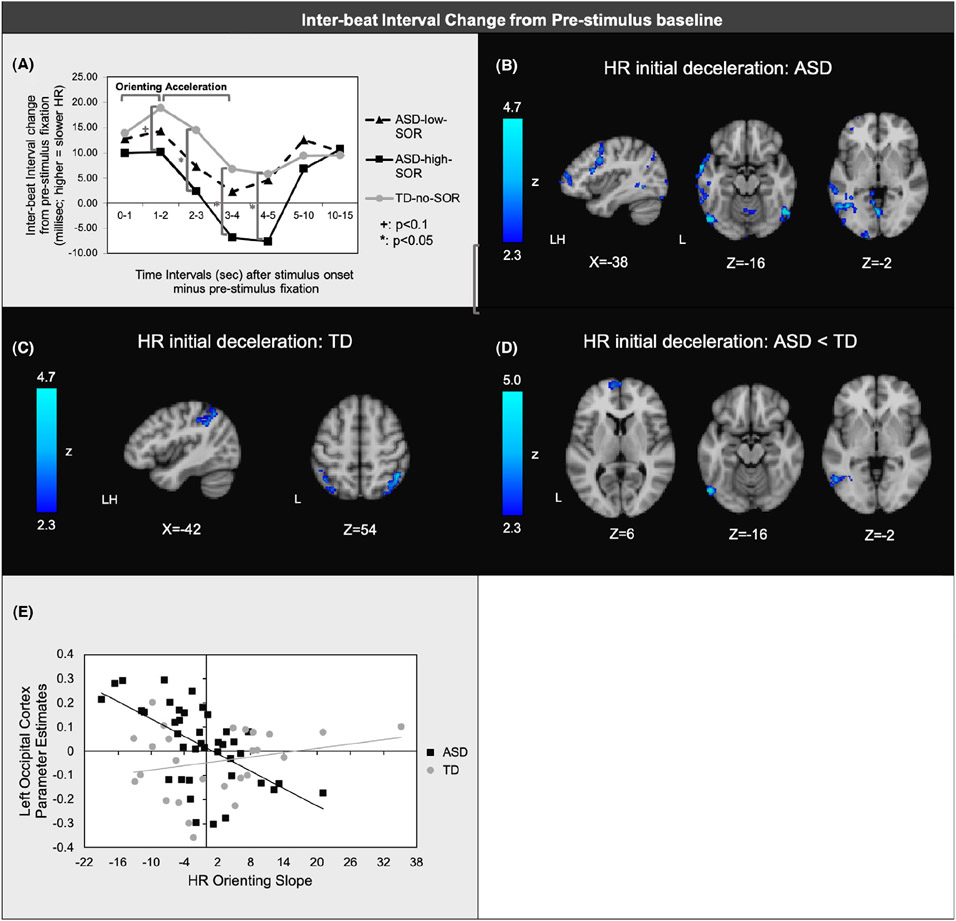
Figure 3.
(a)Mean inter-beat interval (∣B∣) change from the 5-sec prior to stimulus onset to each timepoint after stimulus onset (shown on horizontal axis) averaged across joint, auditory, and tactile trials. First 5 timepoints (orienting and acceleration phrases) show average ∣B∣ across 1-s periods; last 2 timepoints (sustained response/ habituation) show average across 5-s; (b) Regions of significant negative associations between ∣B∣ orienting slopes (0–1 to 1–2 s after stimulus onset) and brain responses to aversive sensory stimulation within ASD and (c) within TD; (d) Regions where orienting slopes showed greater negative correlations with brain responses in ASD vs. TD; (e) Scatterplot illustrating representative correlation between orienting slope and brain responses in each group (here, parameter estimates extracted from areas of lateral occipital cortex shown to have significant diagnostic group differences in the correlation between brain responses and orienting slopes)

