
Figure 2.
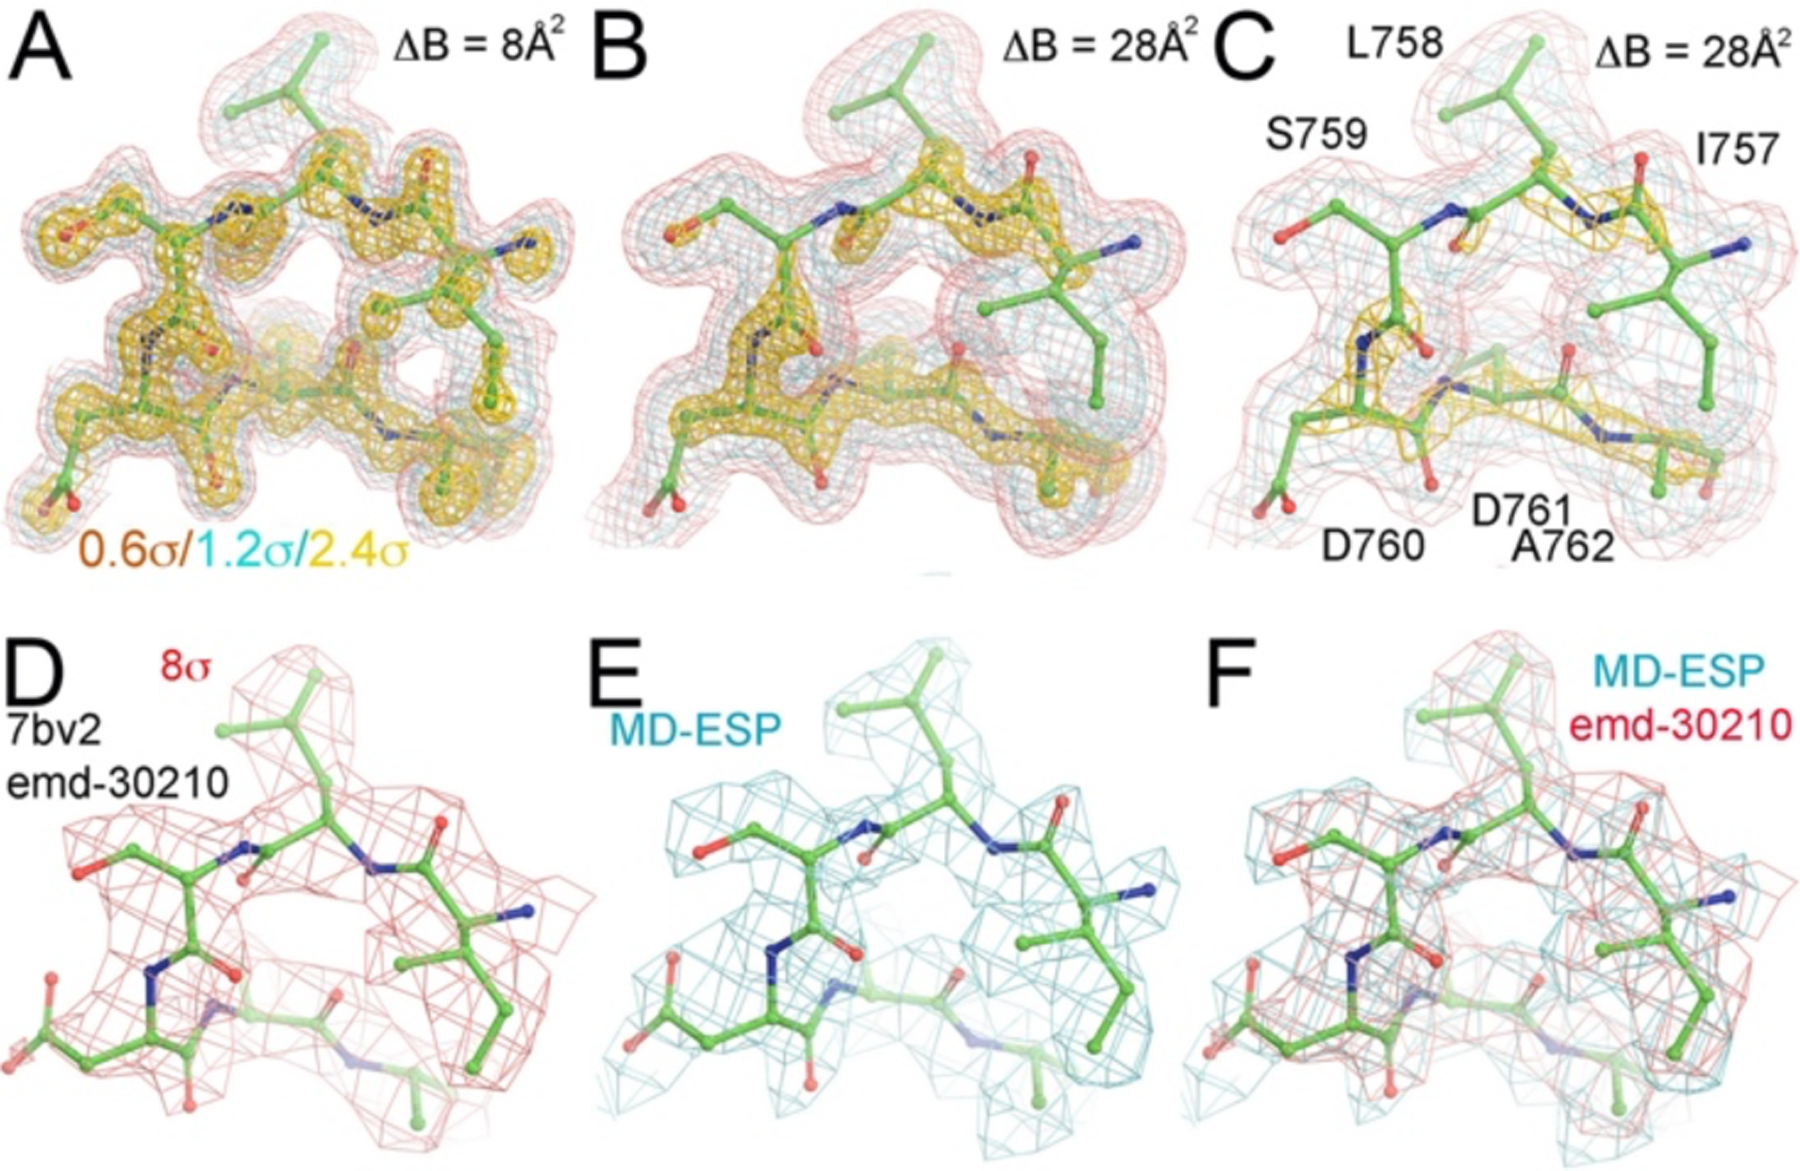
Detailed comparison of MD-ESP maps with the experimental Cryo-EM maps. (A) A close-up view of the MD-ESP map for a catalytic loop (ΔB = 8 Å2) contoured at +0.6σ (salmon), +1.2σ (cyan), and +2.4σ (gold). B) The same catalytic loop of the MD-ESP map as (A) but with ΔB = 28 Å2. (C) The same as (B) but with coarse grid numbers corresponding to about 2.0 Å resolution. (D) The experimental emd-30120 map contoured +8σ. (E) Resampled MD-ESP map on the experimental map grids. (F) Superimposition of MD-ESP maps with the emd-30210 map and reported atomic model.