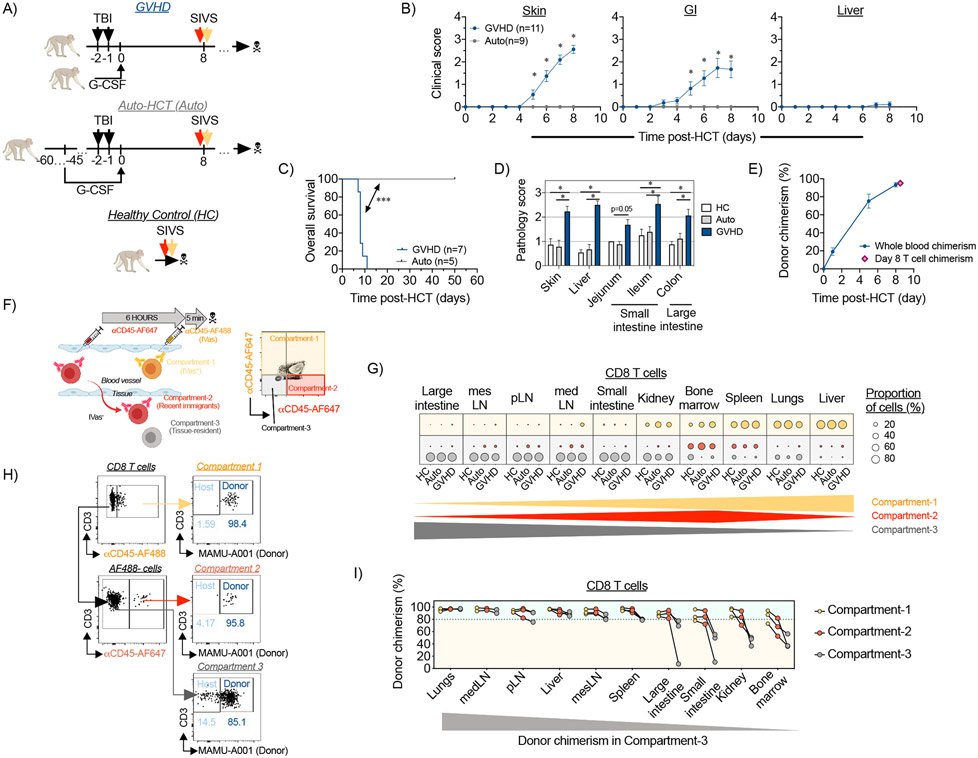
Figure 1. Spatiotemporal compartmentalization of T cells in tissues during aGVHD.
(A-B) The experimental animals received autologous or allogeneic HCT as shown in (A) and clinical aGVHD scores for skin (B, left panel), gastrointestinal tract (B, middle panel) and liver (B, right panel) were calculated for GVHD (n=11 animals) and auto-HCT (n=9 animals) experimental NHP cohorts. *p<0.05, using two-way ANOVA with multiple comparison Holm-Sidak post-test. (C) Overall survival of NHP recipients following allo- and auto-HCT without immunosuppression is presented. Studies with pre-set experimental endpoints were censored. **p<0.01 using log-rank (Mantel-Cox) test. (D) aGVHD histopathology scores were measured for indicated organs from healthy control (HC) animals or HCT recipients on day +8 after allo- or auto-HCT without immunosuppression. *p<0.05, using multiple comparison Holm-Sidak test. (E) Donor chimerism in whole blood or FACS-purified peripheral blood T cells from allo-HCT recipient animals was quantified by microsatellite analysis. (F) Experimental schema and representative flow cytometry plot from HC lung that illustrate the SIVS method using fluorescent αCD45-antibodies to discern cellular compartmentalization and to track cellular migration into tissues are shown. (G) Relative distribution of CD8+ T cells among the intravascular compartment (Compartment-1; green dots), the recent infiltrating cell compartment (Compartment-2; red dots) and the tissue-localized compartment (Compartment-3; gray dots) in the indicated organs from healthy control animals (HC; n=4 animals), auto-HCT recipients (auto-HCT; n=4 animals) and allo-HCT recipients (GVHD; n=4 animals) on day +8 post-transplant. The green, and gray triangles and the red diamond at the bottom of the figure illustrate the pattern of the three compartments in the tissues examined. pLN, peripheral Lymph Nodes; medLN, mediastinal Lymph Nodes; mesLN, mesenteric Lymph Nodes. (H) Measurement of donor chimerism in the colon of an allo-HCT recipient animal, based on discordant expression of MHC-I allele MAMU-A001, in the three different compartments. (I) Donor CD8+ T cell chimerism in different compartments across different organs on day +8 following MAMU-A001-mismatched MHC-haploidentical allo-HCT (n=3 animals). The gray triangle at the bottom of the figure illustrates the pattern of donor chimerism in the tissues examined.

