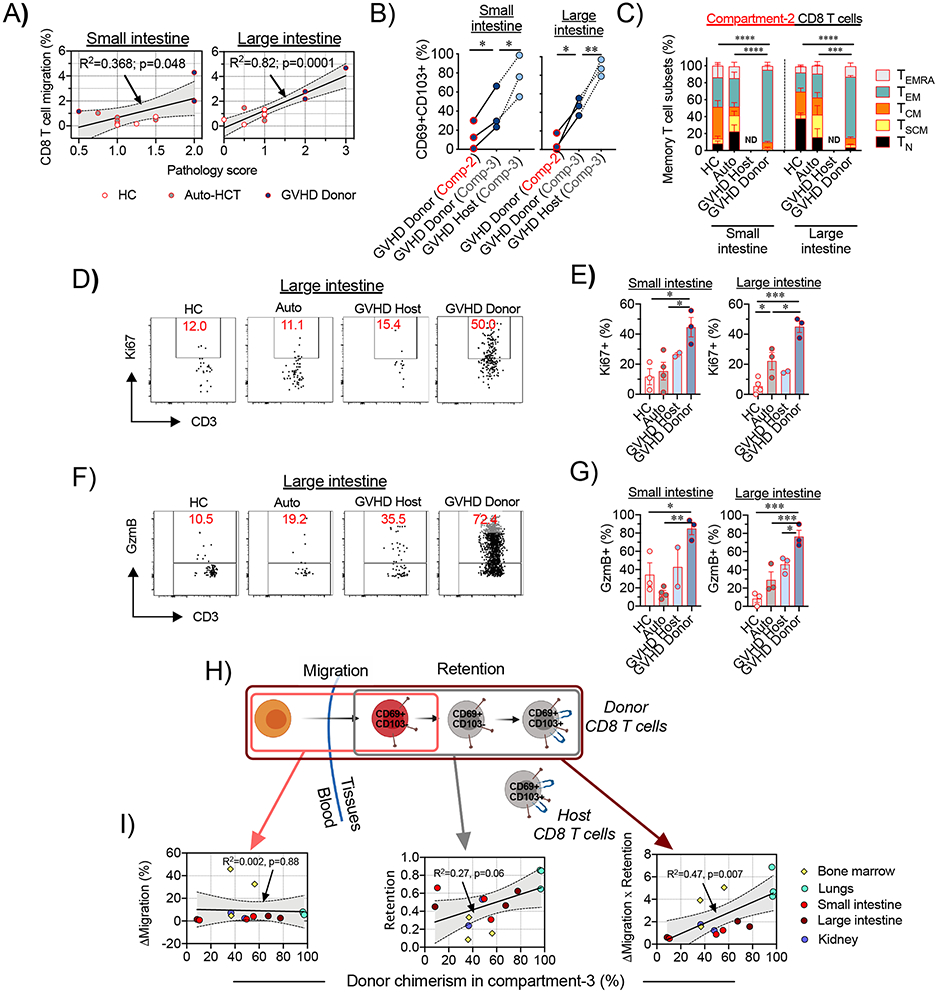
Figure 3. Migration of donor CD8+ T cells to the large and small intestine correlates with the severity of tissue pathology during aGVHD in NHP.

(A) Correlations between the migration of CD8+ T cells and GVHD histopathology scores in the small intestine (jejunum; left panel) and large intestine (colon; right panel) are shown. Lines with tinted areas indicate the 95% CI using linear regression. (B) Percentage of donor or host CD69+CD103+ CD8+ T cells were measured within the recent infiltrating compartment (Compartment-2) and the tissue-localized compartment (Comparment-3). Lines connect corresponding values that were obtained from the same animal. *p<0.05, **p<0.01 using paired t-test. Comp-2 = Compartment-2; Comp-3= Compartment-3. (C) Recent infiltrating (Compartment-2) CD8+ T cells in the small and large intestines from healthy control (HC) animals (n=4 for small intestine and n=3 for large intestine), auto-HCT cohort on day +8 (Auto, n=4 animals) and host (GVHD Host) and donor (GVHD Donor) cells following MAMU-A001-mismatched allo-HCT on day +8 (n=3 animals) were stained for CCR7, CD45RA and CD95 expression and the distributions between memory subsets are shown. ND – no data. (D-E) Representative flow cytometry plots (D) and summary data (E) depict Ki67 expression in recent infiltrating (Compartment-2) CD8+ T cells in the small and large intestine in different experimental cohorts. (F-G) Representative flow cytometry plots (F) and the summary data (G) depict Granzyme B (GzmB) expression in recent infiltrating (Compartment-2) CD8+ T cells in the small and large intestine in different experimental cohorts. For E and G: *p <0.05, **p<0.01, ***p<0.001 using one-way ANOVA with Holm-Sidak multiple comparison post-test. (H) Schematic representation of donor T cell immigration into GVHD-target non-lymphoid tissues and gradual acquisition of the CD69+CD103+ TRM phenotype. (I) Correlations between donor chimerism in tissue-localized CD8+ T cells (Compartment-3) and the difference between the extent of donor and host CD8+ T cell migration (ΔMigration, left panel), extent of acquisition of the CD69+CD103+ TRM phenotype in the immigrated donor CD8+ T cells (Retention, middle panel) and the difference between the extent of donor and host CD8+ T cell migration, adjusted to the extent of acquisition of the CD69+CD103+ TRM phenotype (Migration X Retention), across different non-lymphoid organs and tissues are shown. The lines with the tinted areas indicate the 95% CI using linear regression.
