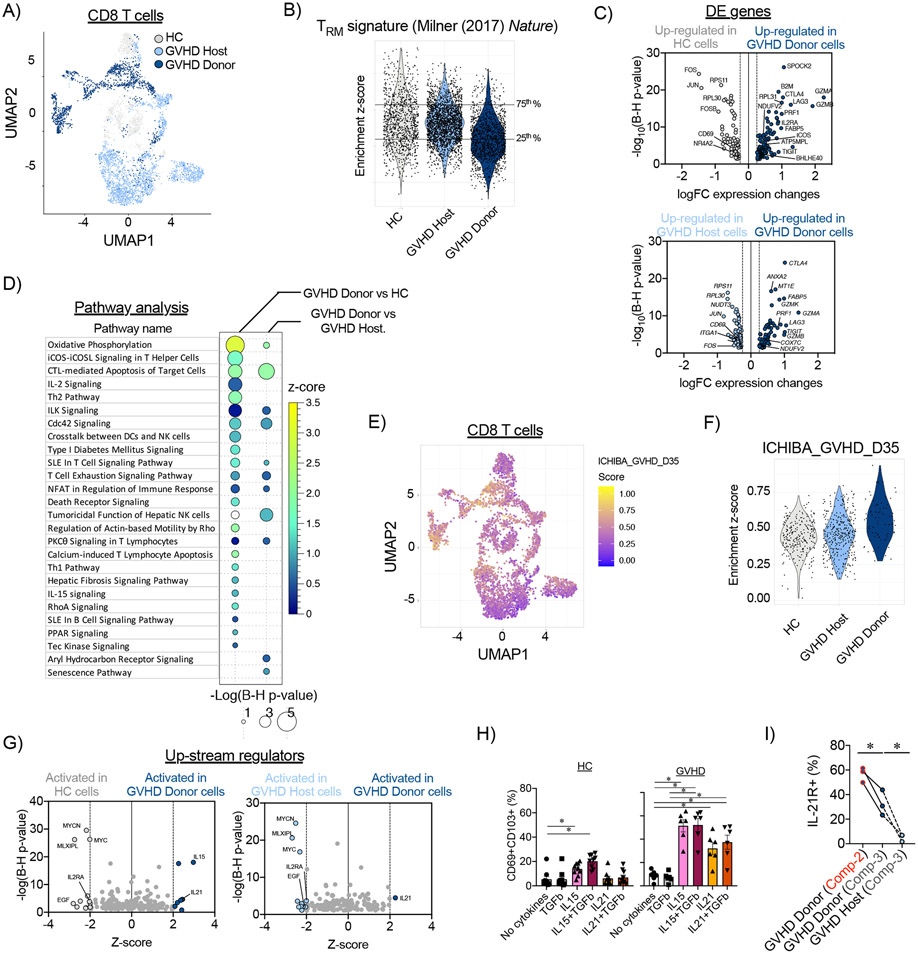
Figure 4. Transcriptomic profile of donor-derived CD8+ TRM cells in the large intestine during aGVHD in NHP.
(A) CD8+ T cell census (n=4,715 cells), colored by experimental cohort, was clustered in Uniform Manifold Approximation and Projection (UMAP) space. (B) Enrichment scores for the TRM-signature from Milner et al, (2017) (37)) were calculated for CD8+ T cells from healthy control (HC) animals, and host and donor CD8+ T cells on day +8 following allo-HCT. Horizontal lines represent the 25th and 75th percentiles for enrichment scores of the healthy control cohort, which were used as cut off values to determine TRM-low and TRM-high cells. (C) Differentially expressed (DE) genes were identified between donor CD8+ TRM-high cells and their counterparts from healthy control (HC) animals (HC; top panel) and host CD8+ T cells (bottom panel). (D) Pathway analysis was performed using Ingenuity Pathway Analysis on differentially expressed genes between donor CD8+ TRM-high cells, and their counterparts from healthy controls and host CD8+ T cells. Signaling pathways with positive enrichment scores and p<0.05 using a t-test with the Benjamini-Hochberg correction are depicted. (E) CD8+ T cell census (n=4,715 cells), colored by the enrichment score for the GVHD signature from Ichiba et al, (2003) (52), was clustered in UMAP space. (F) Enrichment scores for the aGVHD signature (from Ichiba et al, (2003) (52)) were calculated for healthy controls (HC), host, and donor CD8+ TRM-high cells. (G) Predicted up-stream regulators were determined using Ingenuity Pathway Analysis tool performed on DE genes between donor CD8+ TRM-high cells and their counterparts from healthy controls (left panel) and host CD8+ T cells (right panel). (H) Expression of IL-21R in Compartment-2 and Compartment-3 donor and host CD8+ T cells from the large intestines of MAMU-A001-mismatched allo-HCT recipients on day +8 (n=3). *p<0.05 using paired t-test. (I) Spleen cells, isolated from healthy control (HC) animals or animals with aGVHD on day +8 after allo-HCT, were incubated with the indicated cytokines for 48 hours. Then, percentage of CD69+CD103+ CD8+ T cells was measured by flow cytometry. *p<0.05, using one-way paired ANOVA and Holm-Sidak multiple comparison post-test.

