
FIGURE 3.
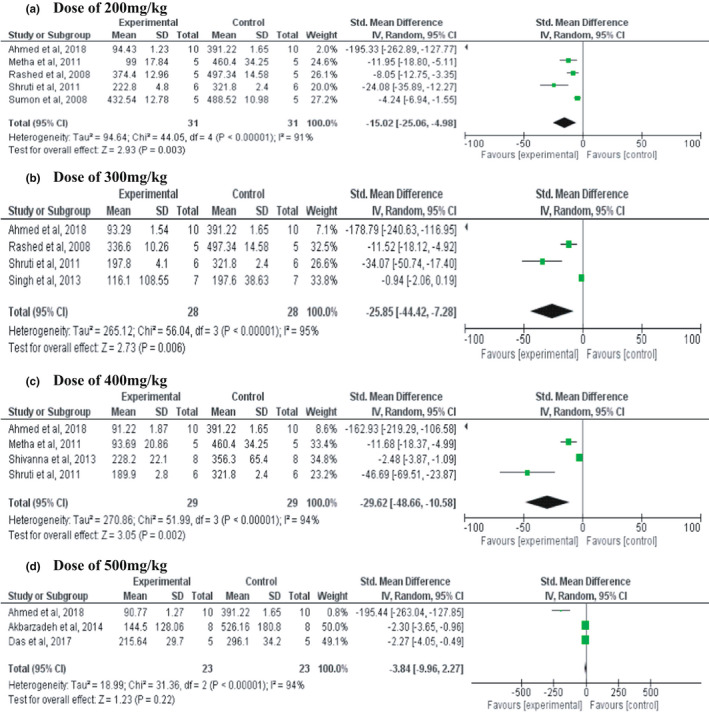
Forest plot of standard mean differences and 95% confidence interval (CI) of blood glucose level in animals treated with different doses of Stevia rebaudiana (200, 300, 400, and 500 mg/kg)
Official websites use .gov
A
.gov website belongs to an official
government organization in the United States.
Secure .gov websites use HTTPS
A lock (
) or https:// means you've safely
connected to the .gov website. Share sensitive
information only on official, secure websites.
Forest plot of standard mean differences and 95% confidence interval (CI) of blood glucose level in animals treated with different doses of Stevia rebaudiana (200, 300, 400, and 500 mg/kg)