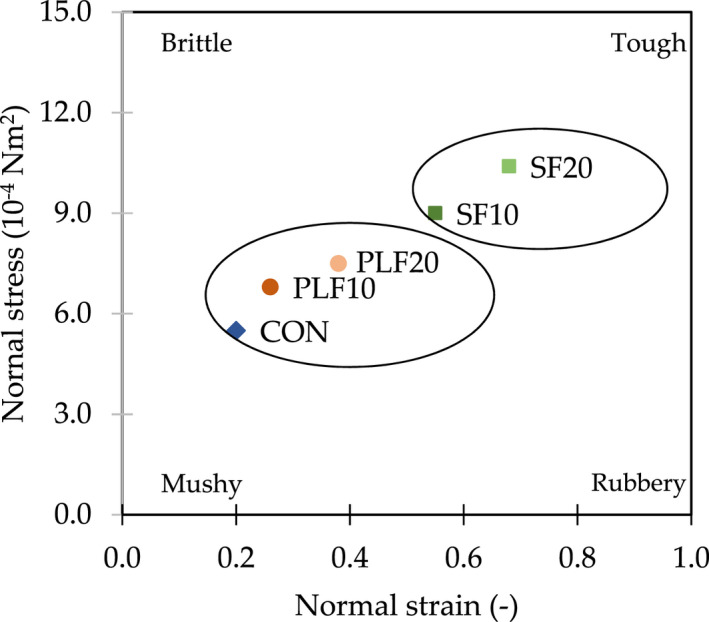
FIGURE 2.

Texture map showing the distribution of textural attributes of control wheat bread and samples with partial substitution of plantain and soy flours. CON, whole wheat flour; PLF10, 10 g of plantain flour/100 g; PLF20, 20 g of plantain flour/100 g; SF10, 10 g of soy flour/100 g; SF20, 20 g of soy flour/100 g
