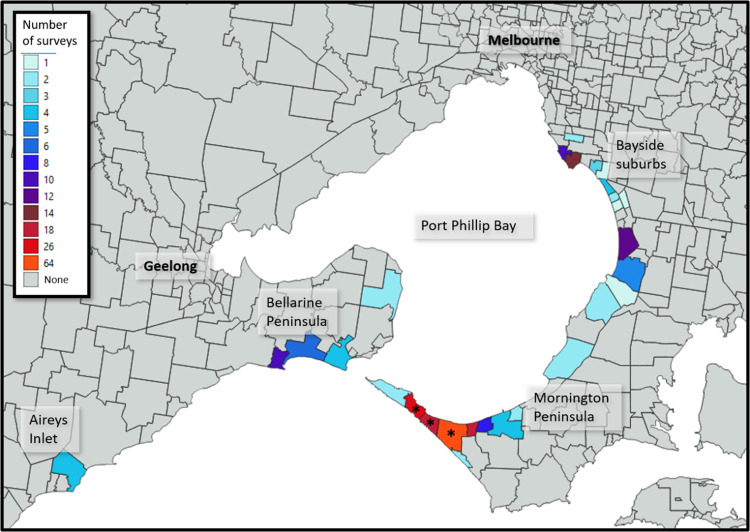
Fig 1. Map of affected area, illustrating the number of property surveys conducted by suburb.
An asterisk (*) is shown on suburbs where repeat sampling was undertaken. N.B. Geographical boundaries are not available by postcode and some postcodes contain more than one suburb. Incorporates Geoscape Administrative Boundaries reprinted from https://data.gov.au/dataset/ds-dga-af33dd8c-0534-4e18-9245-fc64440f742e/distribution/dist-dga-4d6ec8bb-1039-4fef-aa58-6a14438f29b1/details?q= under a CC BY license, with permission from the Commonwealth of Australia, original copyright 2014.

