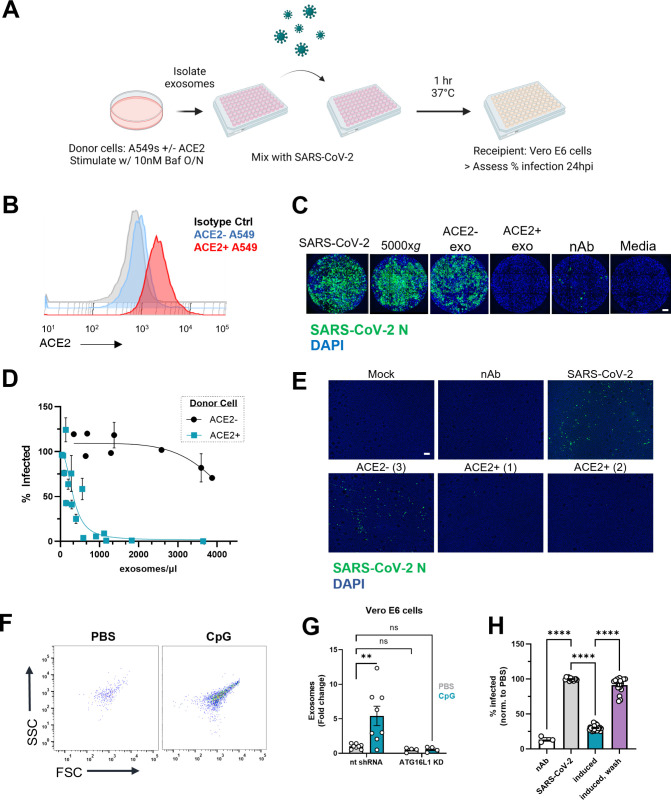
Fig 3. ACE2+ exosomes protect against SARS-CoV-2 infection.
(A) Workflow for exosome neutralization assay used to assess protective effects of mixing SARS-CoV-2 and exosomes. Created with BioRender.com. (B) Representative histogram of cell-surface ACE2 on A549 and A549ACE2 cells. (C) Representative immunofluorescence images of Vero E6 cells infected with SARS-CoV-2, pellet from 5,000xg spin, approximately 20 K exosomes from ACE2− cells, approximately 20 K exosomes from ACE2+ cells, neutralizing antibody, or with media alone stained for viral N protein. Scale bar: 0.625 mm, (D) Percentage of infected Vero E6 cells based on positive staining for N protein after infection with SARS-CoV-2 mixed with exosomes isolated from A549ACE2 (teal) or untransduced A549 cells (black). Compiled means ± SEM from 5 experiments, values normalized to infection with SARS-CoV-2 alone. (E) Representative immunofluorescence images of HAECs infected with mock (media only control), SARS-CoV-2 alone, approximately 11 K (1) or approximately 22 K (2) ACE2+ exosomes with virus, approximately 150 K (3) ACE2− exosomes with virus, and neutralizing antibody with virus (nAb). Images were taken 72 hpi. Scale bar: 0.156 mm. (F) Representative flow cytometry plots of exosomes isolated from Vero E6 cells stimulated with CpG. FSC: forward scatter, SSC: side scatter. (G) Quantification of exosomes from Vero E6 cells and Vero E6 cells transduced with a non-targeting shRNA for ATG16L1 stimulated with PBS (n = 4) or 1 uM CpG-A (n = 4) for 16 h. (H) Quantification of infected cells after infection of Vero E6 cells with SARS-CoV-2 only, SARS-CoV-2 mixed with supernatants of cells pretreated overnight with CpG-A (induced), or SARS-CoV-2 added to CpG-A pretreated cells following removal of supernatant (wash). Exosomes: CD9, CD63, CD81+, PKH67+ events. Means ± SEM of at least 2 independent experiments. G Two-way ANOVA with Dunnett’s post-test compared to NT PBS. H One-way ANOVA with Dunnett’s post-test compared to PBS. Error bars represent the mean ± SEM of at least 2 independent experiments, with measurements taken from distinct samples. Underlying data can be found in S1 Data. ** P ≤ 0.01; **** P ≤ 0.0001. HAEC, human airway epithelial culture; hpi, hours post infection; ns, not significant; SARS‑CoV‑2, Severe Acute Respiratory Syndrome Coronavirus 2.

