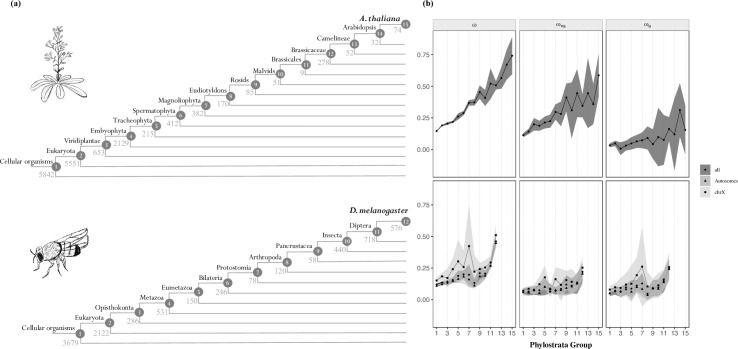
Fig 1.
(a) Phylogenetic definition of the strata used in the analyses for A. thaliana (top) and D. melanogaster (bottom). The number of genes mapped to each clade is shown. (b) Relationship between the rate of protein evolution (ω), nonadaptive nonsynonymous substitutions (ωna), and adaptive nonsynonymous substitutions (ωa) with gene age in A. thaliana (top) and in D. melanogaster (bottom). Clades are ordered according to (a). In D. melanogaster, the results for X-linked, autosomal, and total genes are shown. Mean values of ω, ωna, and ωa for each category are represented with the black points. Error bars denote for the 95% confidence interval for each category, computed over 100 bootstrap replicates. The data (S1 Data) and code needed to generate this table can be found at https://gitlab.gwdg.de/molsysevol/supplementarydata_geneage and https://zenodo.org/record/6828430.

