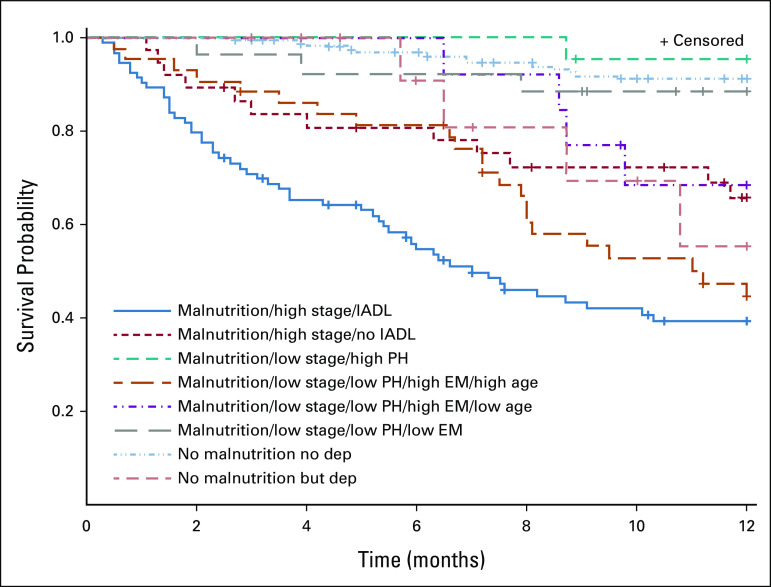
FIG 2.
Kaplan-Meier curve of survival tree clusters depicting product-limit survival estimates: the group with the worst survival had malnutrition, stage IV disease, and impairments in IADLs (denoted by solid blue line). The groups with the best survival consisted of those with normal nutrition and no depressive symptoms (the dashed light blue line) and those with malnutrition, stage I-III disease, and high physical health scores (the dashed teal line). dep, depression; EM, emotional health; high stage, stage IV disease; IADL, instrumental activities of daily living; low stage, I-III; PH, physical health.

