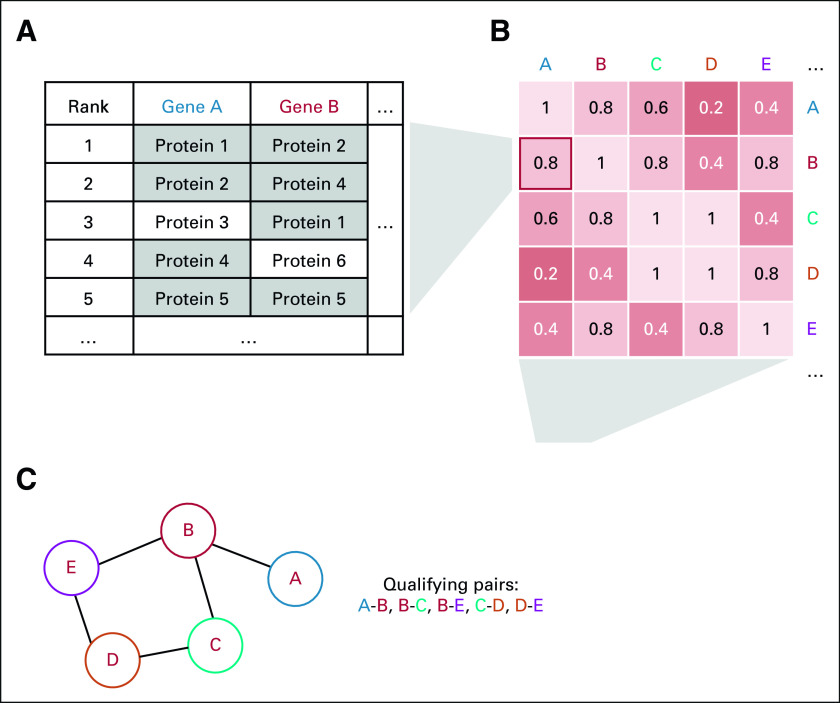
FIG 2.
SNN drives integrated ICON data network. (A) Overlap score is determined by the fraction of shared top k correlates from RPPA, FC. (B) SNN matrix is compiled by performing scoring across all gene pairs for RPPA, FC. (C) Gene pairs meeting score threshold are used to construct the overall network. FC, flow cytometry; ICON, immunogenomic profiling of non–small-cell lung cancer; RPPA, reverse phase protein array; SNN, shared nearest neighbors.

