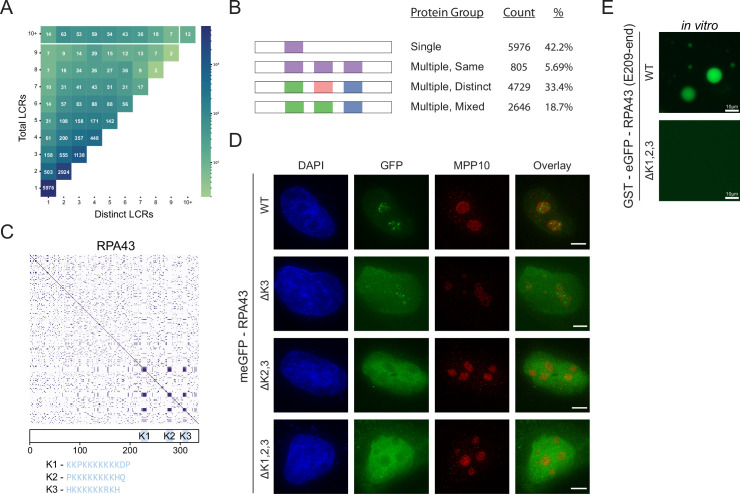
Figure 2. Proteome-wide definition of LCR type and copy number reveals copy number requirements for nucleolar integration of RPA43.
(A) Distribution of total and distinct LCRs for all LCR-containing proteins in the human proteome. The number in each square is the number of proteins in the human proteome with that number of total and distinct LCRs and is represented by the colorbar. (B) Illustration of different protein groups defined by their LCR combinations, and the number and percentage (%) of proteins that fall into each group. Group definitions are mutually exclusive. (C) Dotplot and schematic of RPA43. K-rich LCRs are highlighted in blue, and are labeled K1-K3. Sequences of K1-K3 are shown below the schematic. (D) Immunofluorescence of HeLa cells transfected with RPA43 constructs. HeLa cells were seeded on fibronectin-coated coverslips and transfected with the indicated GFP-RPA43 constructs, and collected ~48 hr following transfection. DAPI, GFP, and MPP10 channels are shown. Scale bar is 5 μm. (E) Droplet formation assays using GFP-fused RPA43 C-terminus in vitro. Droplet assays were performed with 8.3 μM purified protein. Scale bar is 10 μm. See also Figure 2—figure supplement 1.


