. 2022 Sep 13;11:e77058. doi: 10.7554/eLife.77058

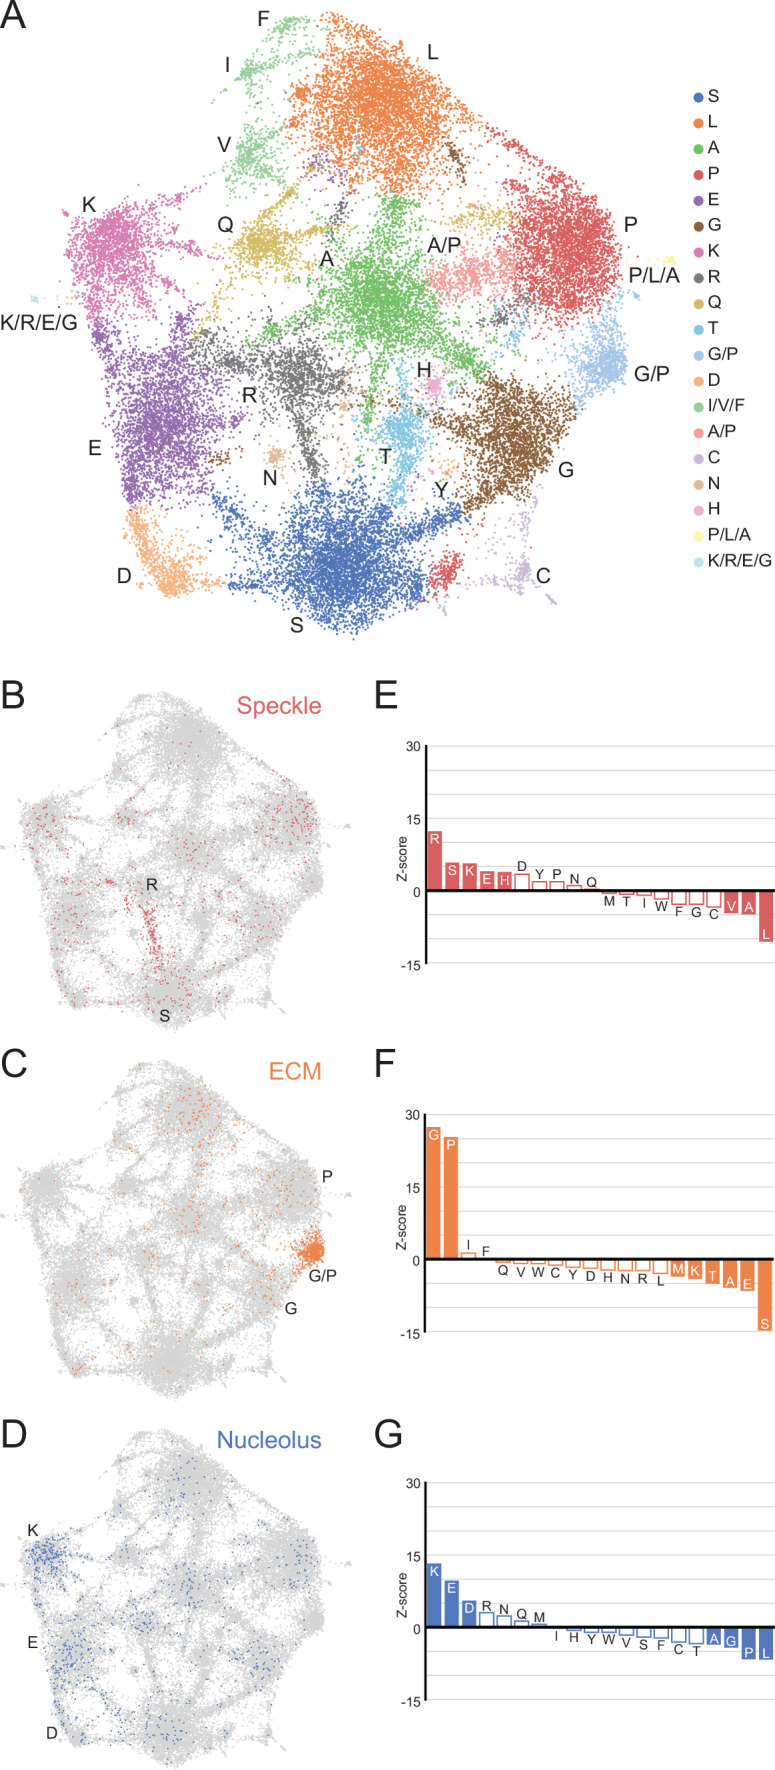
Figure 3. A map of LCRs captures known differences in higher order assemblies.

(A) UMAP of all LCRs in the human proteome. Each point is a single LCR and its position is based on its amino acid composition (see Methods for details). Clusters identified by the Leiden algorithm are highlighted with different colors. Labels indicate the most prevalent amino acid(s) among LCRs in corresponding Leiden clusters. (B) LCRs of annotated nuclear speckle proteins (obtained from Uniprot, see Methods) plotted on UMAP. (C) Same as (B), but for extracellular matrix (ECM) proteins. (D) Same as (B), but for nucleolar proteins. (E) Barplot of Wilcoxon rank sum tests for amino acid frequencies of LCRs of annotated nuclear speckle proteins compared to all other LCRs in the human proteome. Filled bars represent amino acids with Benjamini-Hochberg adjusted p-value < 0.001. Positive Z-scores correspond to amino acids enriched in LCRs of nuclear speckle proteins, while negative Z-scores correspond to amino acids depleted in LCRs of nuclear speckle proteins. (F) Same as (E), but for extracellular matrix (ECM) proteins. (G) Same as (E), but for nucleolar proteins. See also Figure 3—figure supplements 13.

Figure 3.

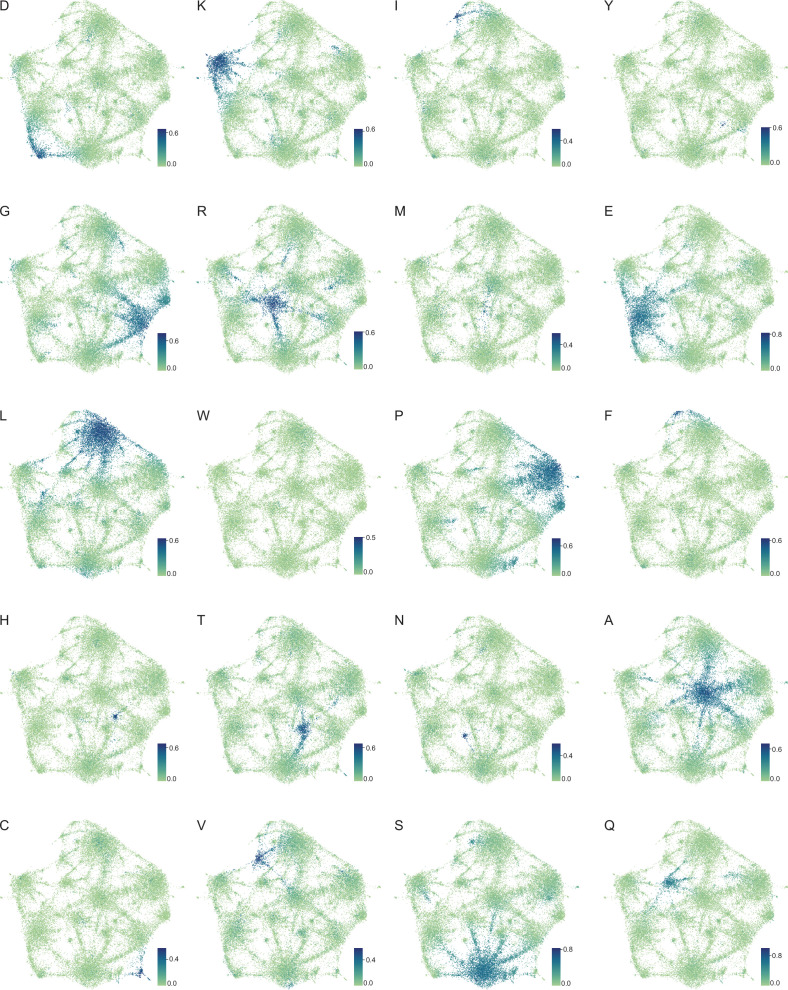
Figure 3—figure supplement 1. Amino acid frequency distributions on human proteome UMAP from Figure 3A.

Figure 3—figure supplement 1.

Color of each dot corresponds to the frequency of the given amino acid in every LCR, as defined by each respective colorbar.
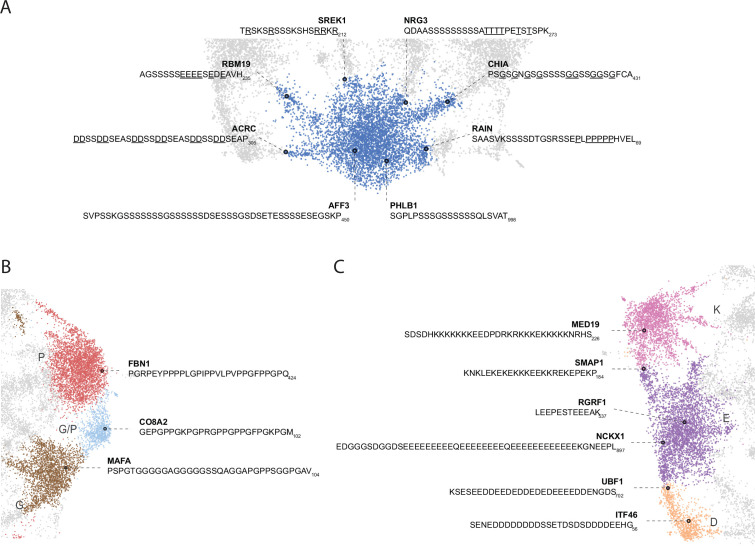
Figure 3—figure supplement 2. Nuanced sequence differences among LCRs correspond to their positions in the UMAP.

Figure 3—figure supplement 2.

Close up view of specific clusters in human proteome UMAP (shown in Figure 3A), with several LCR sequences and their parent proteins annotated. For all LCRs shown, the subscript at the end of the sequence corresponds to the ending position of the LCR in the sequence of its parent protein. (A) Close-up view of S-rich Leiden cluster (bottom of UMAP in Figure 3A). For LCRs along bridges connecting to leiden clusters of other amino acids, the residues of that other amino acid are underlined. For example, the LCR from ACRC lies in the bridge between the S and D clusters, so the D residues are underlined to highlight their frequency. (B) Close-up view of P-rich, G/P-rich, and G-rich Leiden clusters (right side of UMAP in Figure 3A). (C) Close-up view of K-rich, E-rich, and D-rich Leiden clusters (left side of UMAP in Figure 3A).
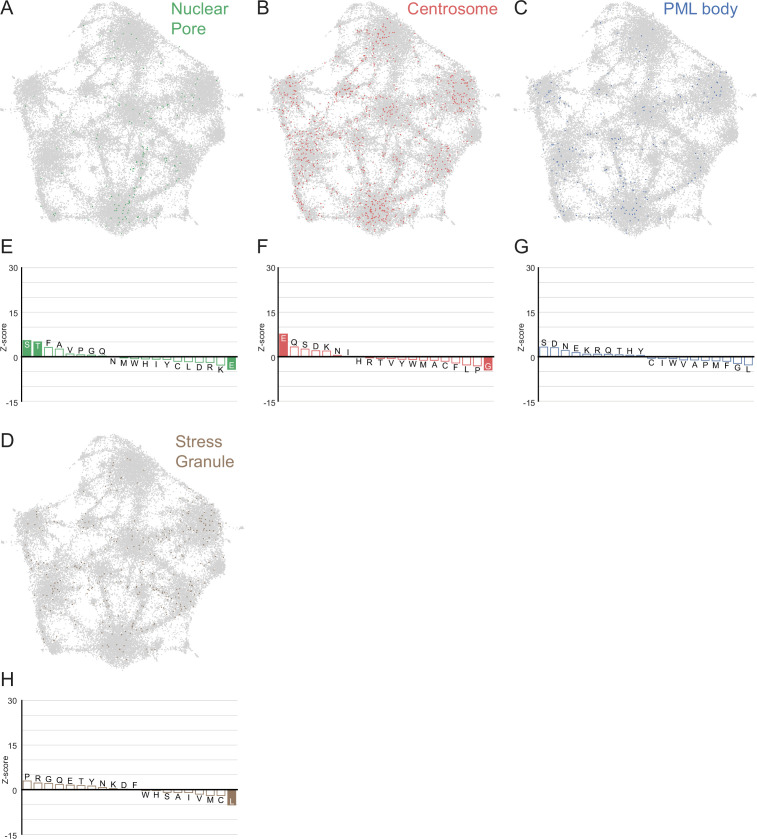
Figure 3—figure supplement 3. LCRs of known higher order assemblies annotated on onto human proteome UMAP from Figure 3A.

Figure 3—figure supplement 3.

(A) LCRs of annotated nuclear pore proteins (obtained from Uniprot, see Methods) plotted on UMAP. (B - D) Same as (A), but for Centrosome, PML body, and Stress Granule (Jain et al., 2016) LCRs. (E) Barplot of Wilcoxon rank sum tests for amino acid frequencies of LCRs of nuclear pore proteins compared to all other LCRs in the human proteome. Filled bars represent amino acids with Benjamini-Hochberg adjusted p-value < 0.001. Positive Z-scores correspond to amino acids significantly enriched in LCRs of nuclear pore proteins, while negative Z-scores correspond to amino acids significantly depleted in LCRs of nuclear pore proteins. (F - H) Same as (E), but for Centrosome, PML body, and Stress Granule LCRs, respectively.