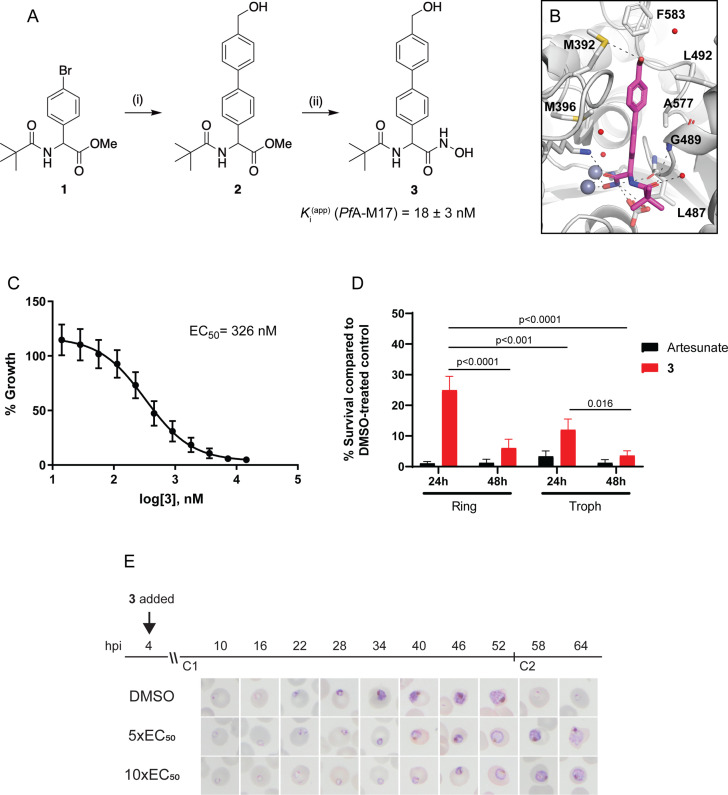
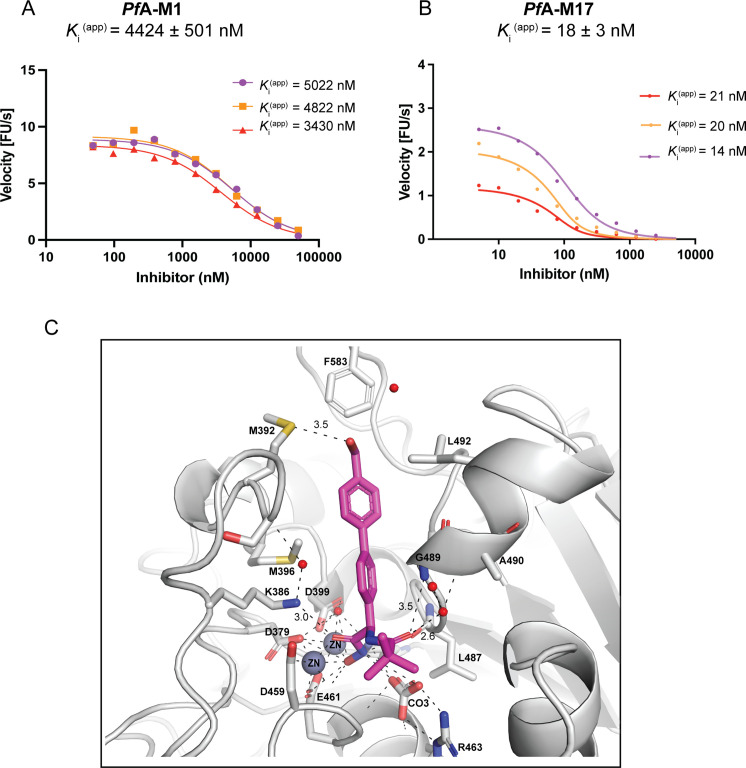
Figure 4. Synthesis and activity of 3, a specific PfA-M17 inhibitor.
(A) Scheme 1. Synthesis of 3: (i) Boronic acid, Pd(PPh3)2Cl2, Na2CO3, THF, 100 °C, 2 hr, (ii) NH2OH.HCl, KOH, RT, 16 hr. Inhibition constant for 3 toward recombinant, purified PfA-M17 is shown. (B) Binding mode of 3 bound to PfA-M17. Solvent-accessible surface of PfA-M17 (grey) with active site ions shown in grey spheres. Stick representation (magenta) shows the binding positions of 3. Molecular interactions between 3 and PfA-M17 are indicated by dashed lines; water molecules are represented by red spheres. (C) Killing action of 3 over 72 hr as determined by SYBR Green I assay. The EC50 value was calculated from four biological replicates performed in triplicate and data plotted as the mean ± standard error of the mean. (D) Parasite killing rate was determined by incubating Pf3D7 parasites in 10 x EC50 as previously determined for either 24 or 48 hr before the drug was washed off and parasites allowed to grow for a further 48 hr. Survival was determined via Sybr Green I assay and compared to vehicle (DMSO)-treated controls. Shown is the mean ± standard deviation (n=4). Statistical significance was determined using a one-way ANOVA. (E) Synchronized parasites at 4 hr post-invasion (hpi) were treated over two cycles (C1, cycle 1; C2, cycle 2) with either 5 x or 10 x EC50 or DMSO at the concentration present in the 10 x EC50 treatment. Representative Giemsa-stained smears from two biological replicates show delay in parasite maturation to schizogony (5 x EC50) or trophozoite stage (10 x EC50).


