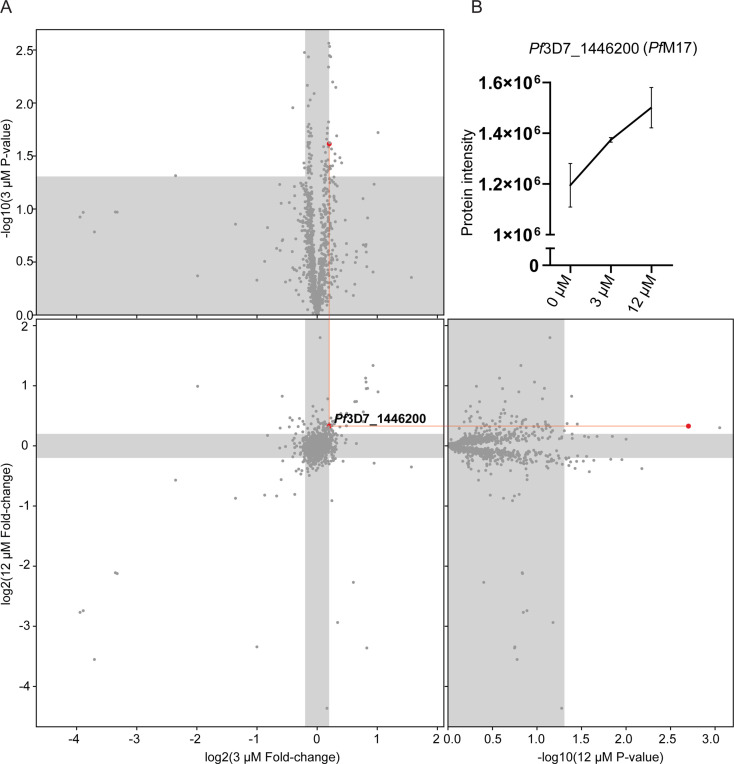
Figure 6. Thermal proteome profiling identified PfA-M17 to be the target of compound 3.
(A) Paired volcano plot of all proteins detected. The outside panels show the log2 fold change vs –log10 p-value of proteins following treatment with 3 µM or 12 µM of compound 3, relative to the 0 µM negative control, following a 60 °C thermal challenge. Proteins significantly (p-value > -log10 (0.05) Welch’s t test) stabilized (fold change >log2 (1.15)) or destabilized (fold change <log2 (0.87)) appear in the unshaded regions. The thermal stability of a single protein (Pf3D7_1446200) was altered at both concentrations with a p- value <0.05, with increasing stability in increasing concentrations of compound 3. This is indicated via red lines and dots. (B) Protein intensity of Pf3D7_1446200 (PfA-M17) in increasing concentration of compound 3 and following 60 °C thermal challenge. Value represents the mean of four technical replicates ± standard deviation.

