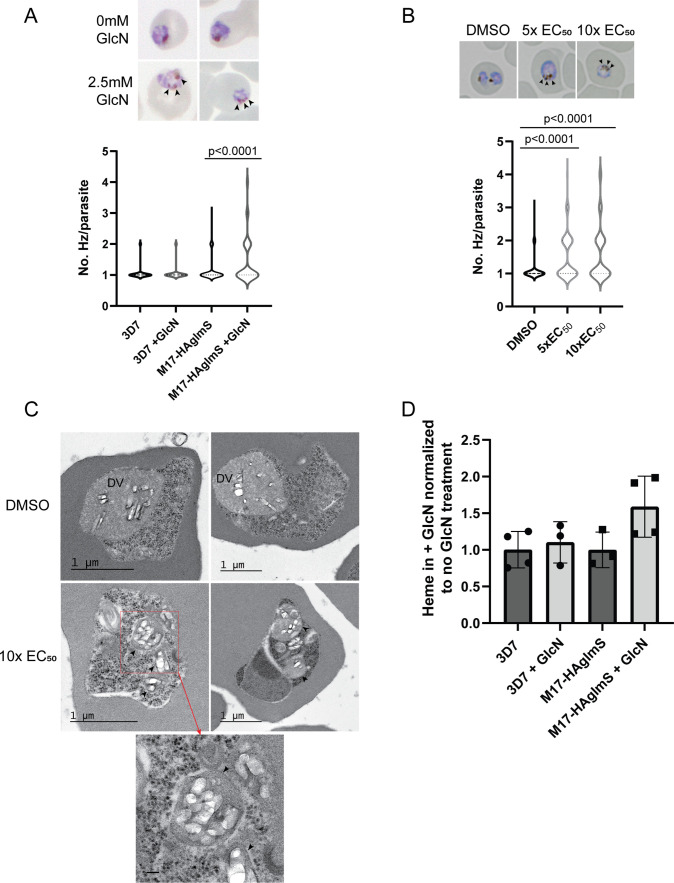
Figure 7. Parasites depleted of PfA-M17 develop significantly more digestive vacuoles.
(A) Upper panel: Representative Giemsa-stained smears of PfA-M17-HAglmS ± GlcN; black arrowheads indicate multiple digestive vacuoles. Lower panel: Number of digestive vacuoles per Pf3D7 and PfA-M17-HAglmS the cycle following addition of glucosamine (GlcN) as determined under Giemsa-staining. Shown is the median with range combined from four biological replicates (n≥100). Statistical significance was determined by a one-way ANOVA followed by Dunn’s Multiple Comparison test (a nonparametric post hoc). (B) Upper panel: Representative Giemsa-stained smears of Pf3D7+ DMSO, 5 x or 10 x the EC50 of 3; black arrows indicate multiple digestive vacuoles. Lower panel: Number of digestive vacuoles per Pf3D7 following the addition of 3 at 4 hr post invasion (hpi) as determined under Giemsa-staining. Shown is the median with range combined from two biological replicates (n≥100). Statistical significance was determined by a one-way ANOVA followed by Dunn’s Multiple Comparison test (a nonparametric post hoc). (C) Representative transmission electron micrographs of two Pf3D7 parasites treated with 10 x EC50 of 3 (lower panels) and two with DMSO vehicle control (upper panels). Images show hemozoin crystals (white block shapes) bound within digestive vacuoles (DVs). DVs in treated parasites are indicated by black arrowheads. In the higher magnification micrograph of the lower left panel (corresponding area indicated by red dashed box), the arrowheads indicate the membrane surrounding each of the DV profiles. Scale bar in the high magnification represents 100 nm. (D) Free heme representative of hemozoin in Pf3D7 and PfA-M17-HAglmS GlcN-treated parasites relative to untreated parasites. Shown is the mean ± standard deviation (n≥3). No significance difference between groups was found using an unpaired t-test.

