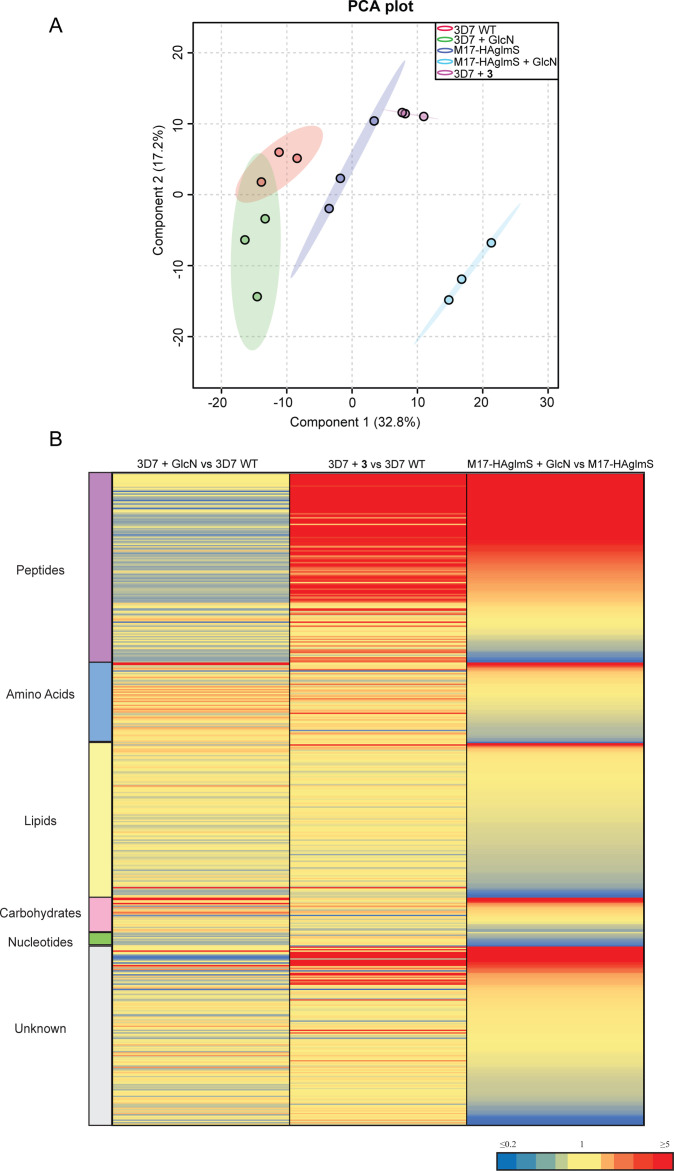
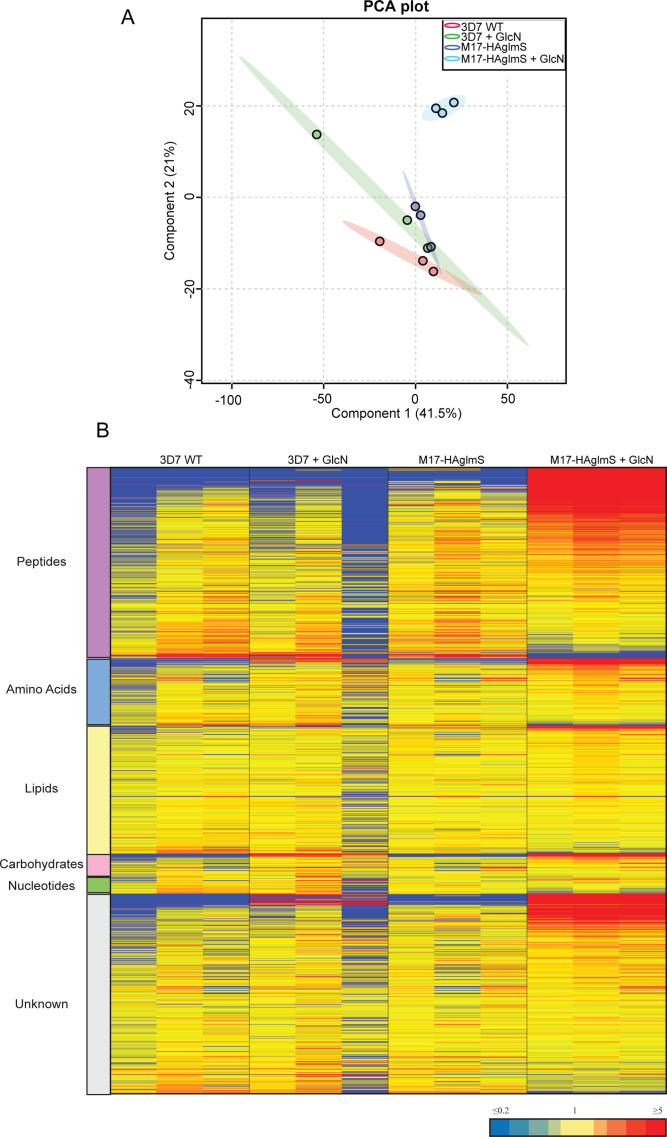
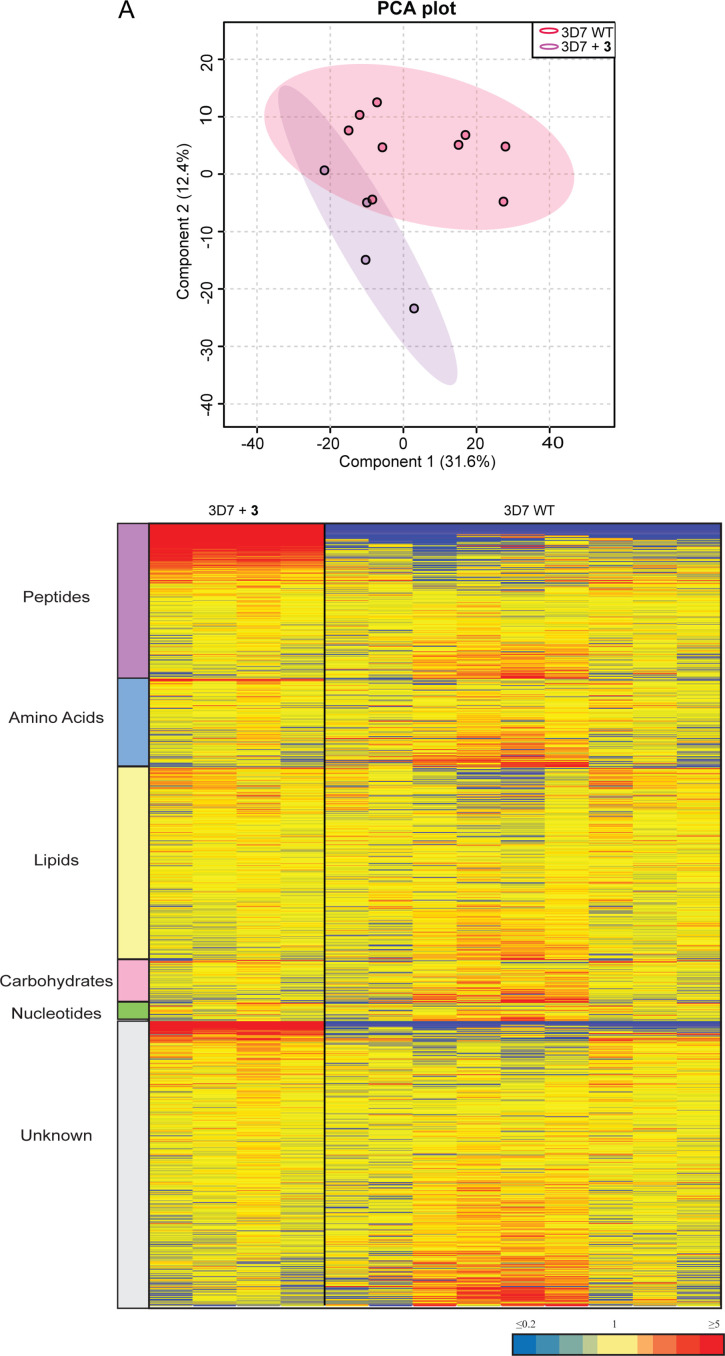
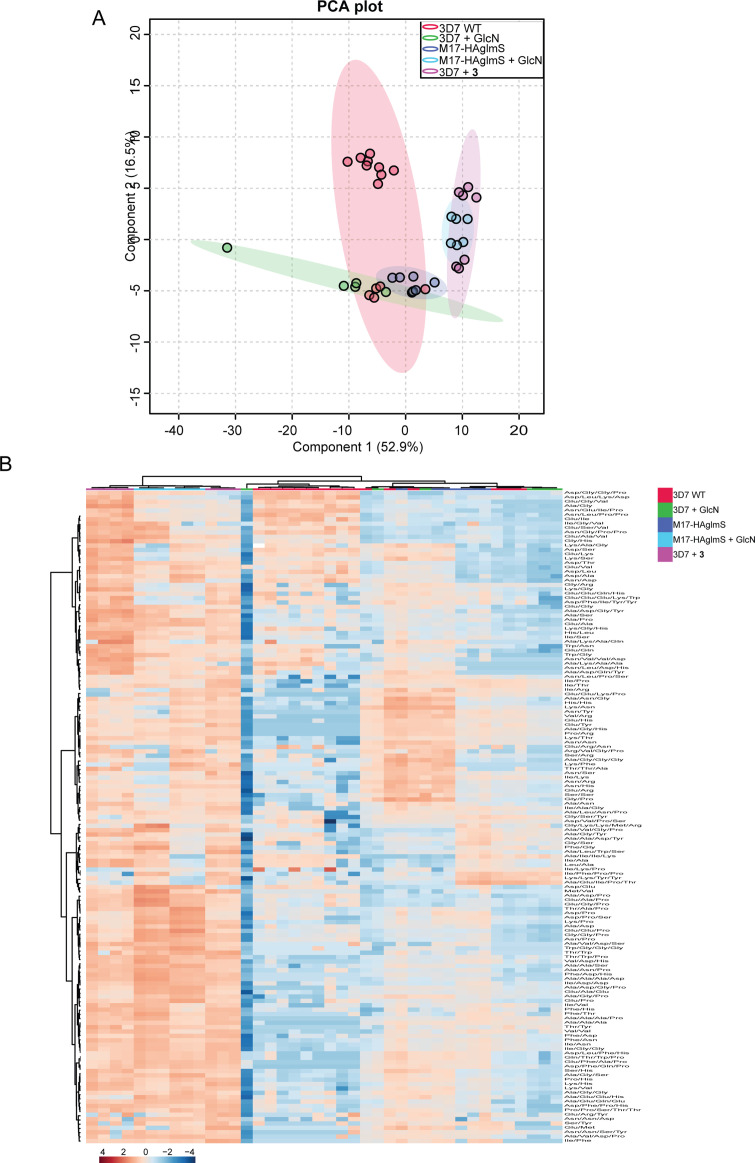
Figure 8. Untargeted metabolomics analysis of PfA-M17-HAglmS and Pf3D7 parasites treated with ± GlcN and of Pf3D7 parasites treated with 3 from experiment 1.
(A) Principal component analysis (PCA) of parasites (PfA-M17-HAglmS and Pf3D7) treated with ± GlcN and 3 or DMSO control. Scores plot show principal components one and two, data points indicate individual sample replicates within each condition and the shaded area denotes 95% confidence interval. (B) Heatmap showing the average fold change for all putative metabolites for the three treatment conditions of Pf3D7+ GlcN versus WT, Pf3D7 +compound 3 versus WT, and PfA-M17HAglmS + GlcN versus PfA-M17HAglmS. For PfA-M17HAglmS + GlcN versus PfA-M17HAglmS, the fold change values have been ordered from highest to lowest. Values represent the average of three technical replicates, red, blue, and yellow indicates increase, decrease and no change, respectively, in the fold change of putative metabolites identified.


