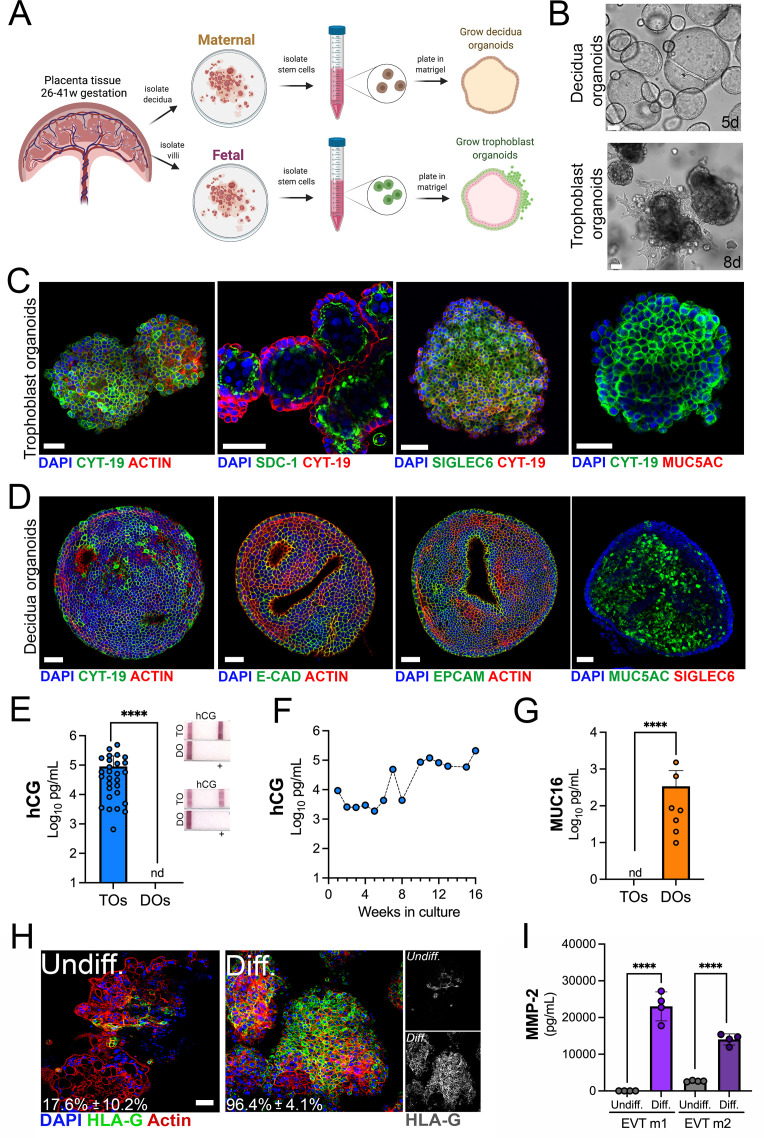
Figure 1. Long-term three-dimensional organoids cultures can be established from human mid- and late-gestation placental tissue.
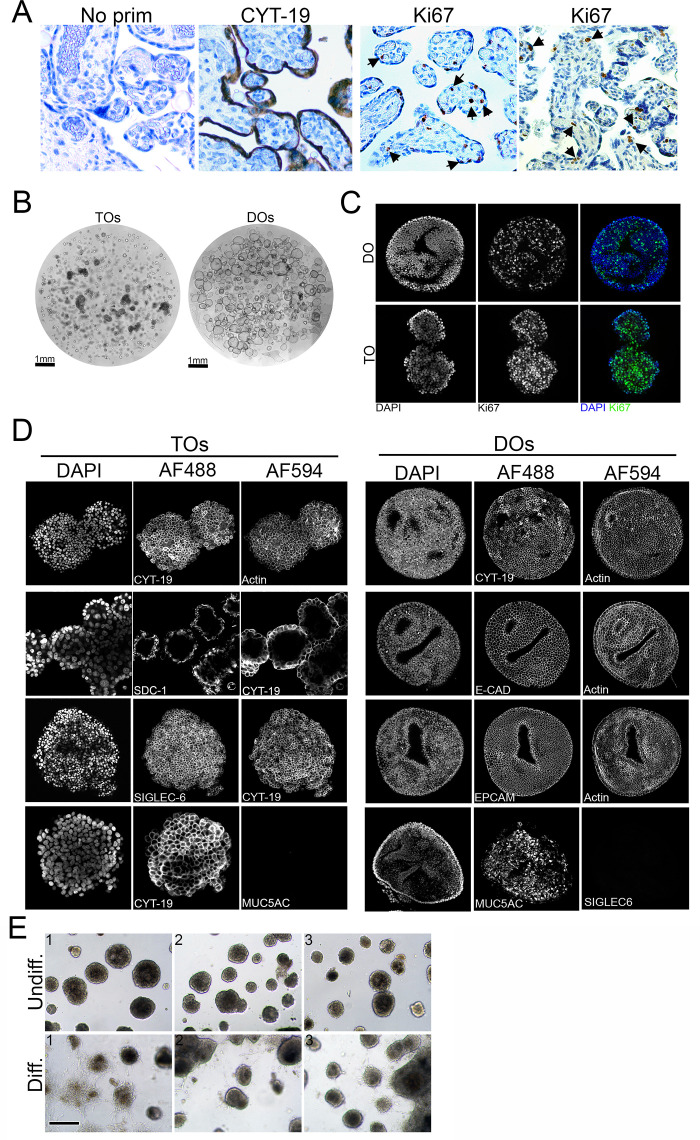
(A) Schematic representation of the derivation of trophoblast organoids (TOs) and decidual organoids (DOs) from mid-to-late gestation placental tissue. (B) Representative bright-field images of TOs and DOs after passaging in complete growth medium TOM and ExM, respectively at 5 days (DO, top) or 8 days (TO, bottom) post-passaging. Scale bar, 50 µm. (C) Confocal microscopy in TOs immunostained for (from left) cytokeratin-19, SDC-1, SIGLEC-6, cytokeratin-19 (in green) and actin, cytokeratin-19, or MUC5AC (in red). DAPI-stained nuclei are shown in blue. Individual channels are shown in Figure 1—figure supplement 1D. Scale bar, 50 µm. (D) Confocal microscopy in DOs immunostained for (from left) cytokeratin-19, E-cadherin (E-cad), EpCAM, or MUC5AC (in green) and actin or SIGLEC6 (in red). DAPI-stained nuclei are shown in blue. Individual channels are shown in Figure 1—figure supplement 1D. Scale bar, 50 µm. (E) Levels of hCG in conditioned medium (CM) isolated from TOs (blue) or DOs (orange) as determined by Luminex. At right, over the counter (OTC) pregnancy tests for hCG in two matched TO and DO lines. (F) Levels of hCG in CM isolated from TOs throughout a 16-week culture period as determined by Luminex. (G) Levels of secreted Mucin-16 (MUC16) in CM isolated from TOs (light blue) or DOs (orange) as determined by Luminex assays. (H) Confocal microscopy in TOs differentiated into an EVT-enriched phenotype (Diff., right) or cultured under standard growth conditions (Undiff., left), and immunostained with HLA-G (in green). Actin is shown in red and DAPI-stained nuclei in blue. At right, black and white images of HLA-G in undifferentiated (top) or differentiated (bottom) conditions. (I) Levels of MMP-2 in the media of undifferentiated (undiff.) or EVT-differentiated (diff.) TOs as assessed by Luminex assays. Shown are media isolated from both stages of EVT differentiation, medium 1 (EVT m1), which contains NRG1, and medium 2 (EVT m2), without NRG1. In (E), (G), and (I), each symbol represents an individual CM preparation and significance was determined by Mann-Whitney U-test. ****, p<0.0001 and nd, not detected. EVT, extravillous trophoblast; hCG, human chorionic gonadotropin.


