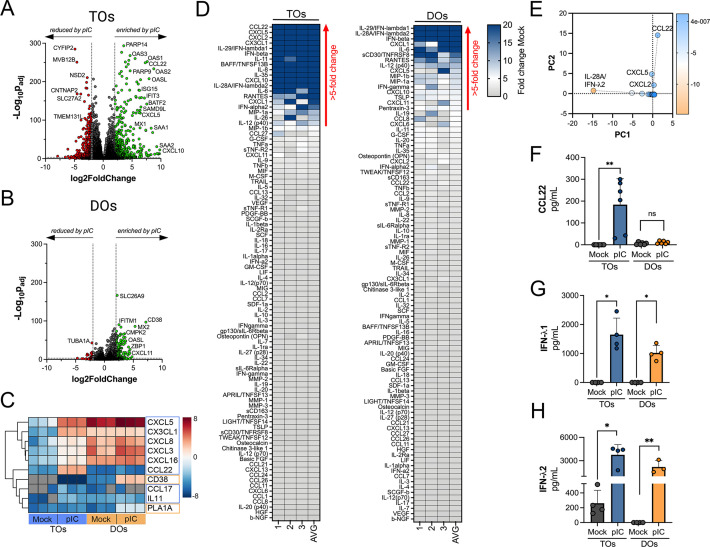
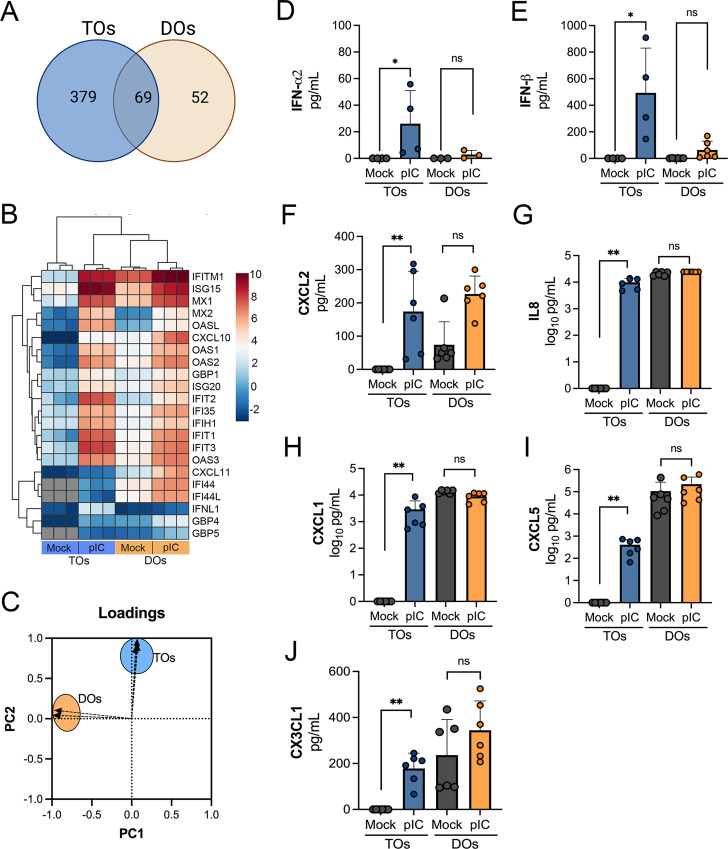
Figure 5. Differential cytokine and chemokine release in trophoblast organoids (TOs) and decidua organoids (DOs) treated with poly I:C.
(A, B) Volcano plots demonstrating differentially expressed transcripts in TOs (A) or DOs (B) treated with poly I:C as assessed by DeSeq2 analysis. Gray circles represent genes whose expression was not significantly changed and green denotes transcripts significantly induced by poly I:C treatment whereas red denotes transcripts significantly reduced by poly I:C treatment. Significance was set at p<0.01 and log2 fold-change of ±2. (C) Heatmap (based on log2 RPKM values) of select transcripts induced uniquely by poly I:C treatment of TOs (blue boxes) or DOs (orange boxes). Key at right. Red indicates high levels of expression, blue indicates low levels of expression, and gray indicates no reads detected. Hierarchical clustering is on the left. (D) Heatmaps demonstrating the induction of factors at left (shown as fold change from mock-treated controls) from TOs (left panel) and DOs (right panel) treated with 10 μg poly (I:C) and analyzed by multiplex Luminex-based profiling for 105 cytokines, chemokines, and other factors. AVG denotes the average change in concentration of factors over conditioned medium (CM) isolated from three individual preparations. Dark blue denotes significantly induced factors compared with untreated controls. Gray or white denotes little to no change (scale at top right). The red arrow demonstrates factors with induction greater than fivefold change observed in the average of separate experiments. Data are from three individual CM preparations from at least three unique matched organoid lines. (E) Principal component analysis of Luminex data shown in left panels identify factors differentially induced by poly I:C treatment of TOs and DOs. (F–H) Levels of CCL22 (F), IFN-λ1 (G), and IFN-λ2 (H) in CM isolated from poly I:C-treated TOs (blue) or DOs (orange) or in mock-treated controls (gray). In (F–H), each symbol represents individual CM preparations. In (F–H), data are shown as mean ± standard deviation and significance was determined using a Mann-Whitney U-test. **p<0.01, *p<0.05; ns, not significant.


