
FIGURE 1.
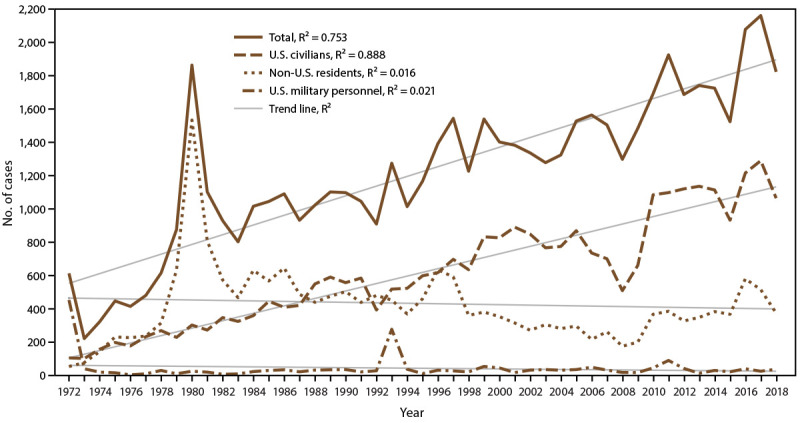
Number of malaria cases* among U.S. civilians, U.S. military personnel, and non-U.S. residents — United States, 1972–2018
Abbreviation: R2 = square of the Pearson product moment correlation coefficient.
* 2018: N = 1,823.
Official websites use .gov
A
.gov website belongs to an official
government organization in the United States.
Secure .gov websites use HTTPS
A lock (
) or https:// means you've safely
connected to the .gov website. Share sensitive
information only on official, secure websites.
Number of malaria cases* among U.S. civilians, U.S. military personnel, and non-U.S. residents — United States, 1972–2018
Abbreviation: R2 = square of the Pearson product moment correlation coefficient.
* 2018: N = 1,823.