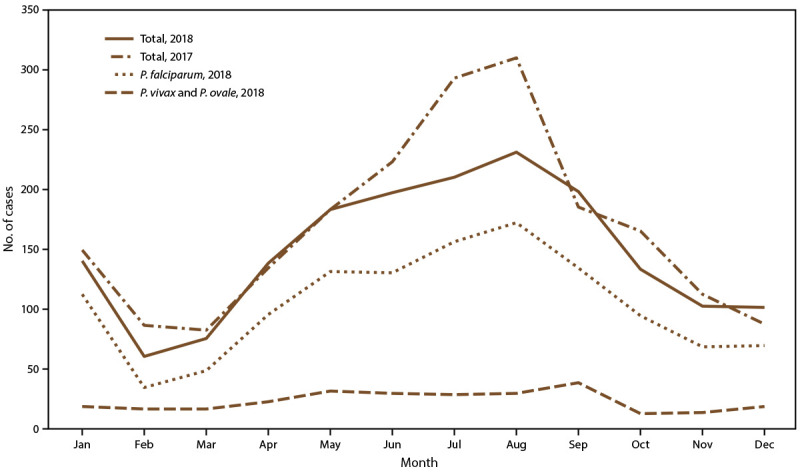
FIGURE 2.

Number* of imported malaria cases, by Plasmodium species and month of symptom onset — United States, 2017† and 2018§
* 2017: N = 2,009; 2018: N = 1,768.
† Information about the month of illness onset was available for 2,009 (95.1%) of 2,112 imported cases.
§ Information about the month of illness onset was available for 1,768 (98.9%) of 1,788 imported cases. The mean number of imported cases per month in 2018 was 147.3.
