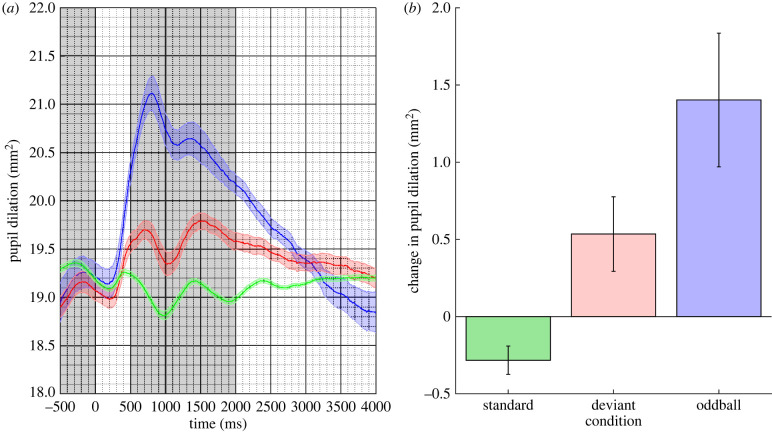
Figure 1.
(a) Mean pupil responses to the standard (in green), deviant (in red) and oddball (in blue) stimuli for Experiment 1. The coloured shaded regions represent the standard error of the mean corrected for within-subject and condition variance. (b) The estimated marginal mean difference in pupil response between the pre-stimulus baseline and stimulus response epochs (shaded in grey in (a)) for the three conditions. Error bars are 95% confidence intervals. (Online version in colour.)

