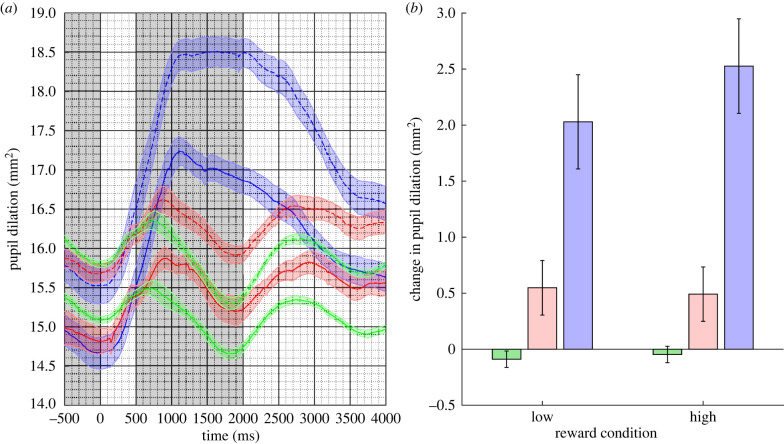
Figure 3.
(a) Mean pupil responses to the oddball (in blue), deviant (in red) and standard (in blue) stimuli for the high-reward (dotted lines) and low-reward (solid lines) conditions in Experiment 3. The coloured shaded regions represent the standard error of the mean corrected for within-subject and condition variance. (b) The estimated marginal mean difference in pupil response between the pre-stimulus baseline and stimulus response epochs (shaded in grey in (a)) for the high- and low-reward conditions. Error bars are 95% confidence intervals. (Online version in colour.)

