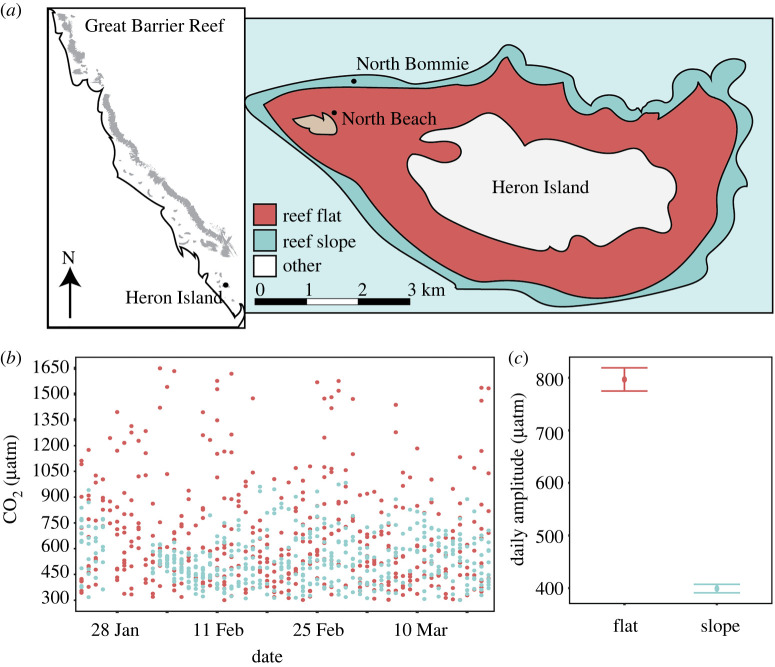
Figure 1.
(a) Cartoon map of the Great Barrier Reef showing the approximate location of Heron Island, with the inset displaying the geomorphological zones and study sites at Heron Island. (b) In situ CO2 profiles, where points indicate individual measurements, were recorded from the reef flat and reef slope in 2016. (c) Daily in situ CO2 amplitude is shown as means ± s.e. (Online version in colour.)

