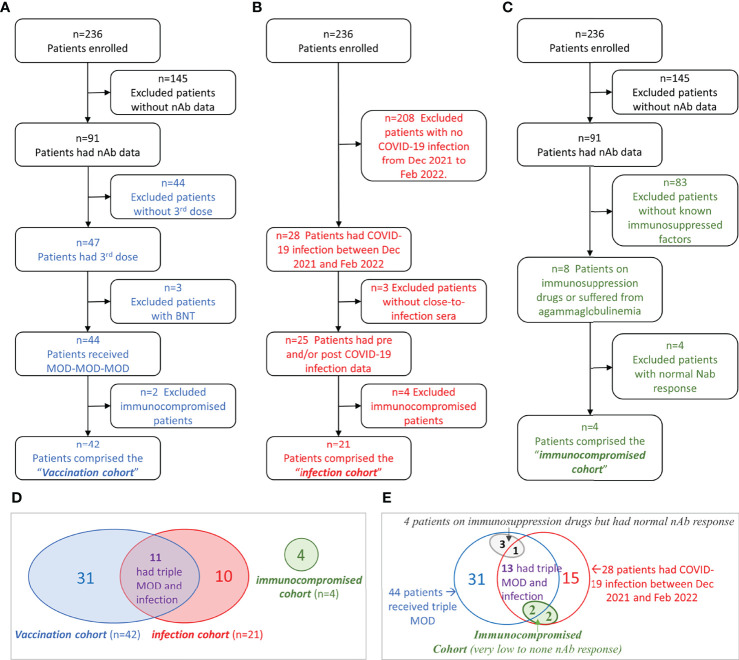
Figure 1.
Flowchart of cohort selection and Venn diagrams of the patient groups. (A–C) Flowchart of patient selection of the vaccination cohort (A), infection cohort (B), and immunocompromised cohort (C). (D) Venn diagram showing the patient overlap between the three cohorts. (E) Venn diagram showing the relationships among immunocompromised status (other than kidney disease), vaccination, and COVID-19 infection in hemodialysis (HD) patients.

