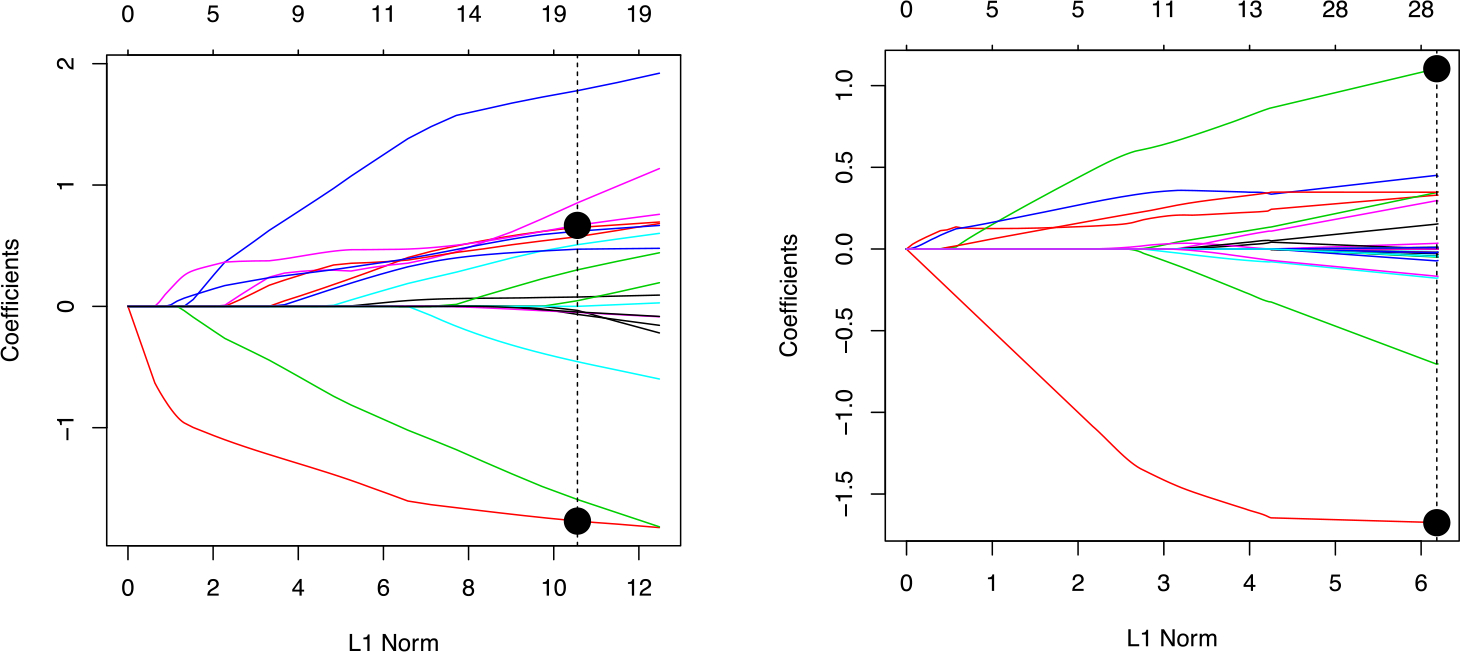
FIGURE 4.

A comparison of the selection paths from lasso logistic regression (left) and the single stage log-ratio lasso (right). The top horizontal labels indicate how many variables are in the model at each point along the path. Dashed vertical lines indicate the tuning parameter selected by cross-validation. The coefficients of glucose and citrate for the optimal value of the tuning parameter are marked with large circles. Notice that citrate is not easily picked out on the left plot, but it is easily picked out on the right.
