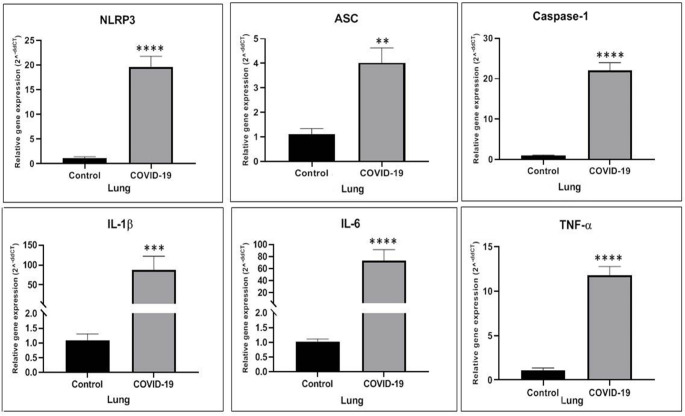
Fig. 1.
The NLRP3, ASC, Caspase-1, IL-1β, IL-6 and TNF-α genes expression elevated in the lung of COVID-19 group in comparison to the Control group. * p < 0.05 compared to the Control group, ** p < 0.01 compared to the Control group, *** p < 0.001 compared to the Control group and **** p < 0.0001 compared to the Control group (N = 5 per group, 3 replicates)

