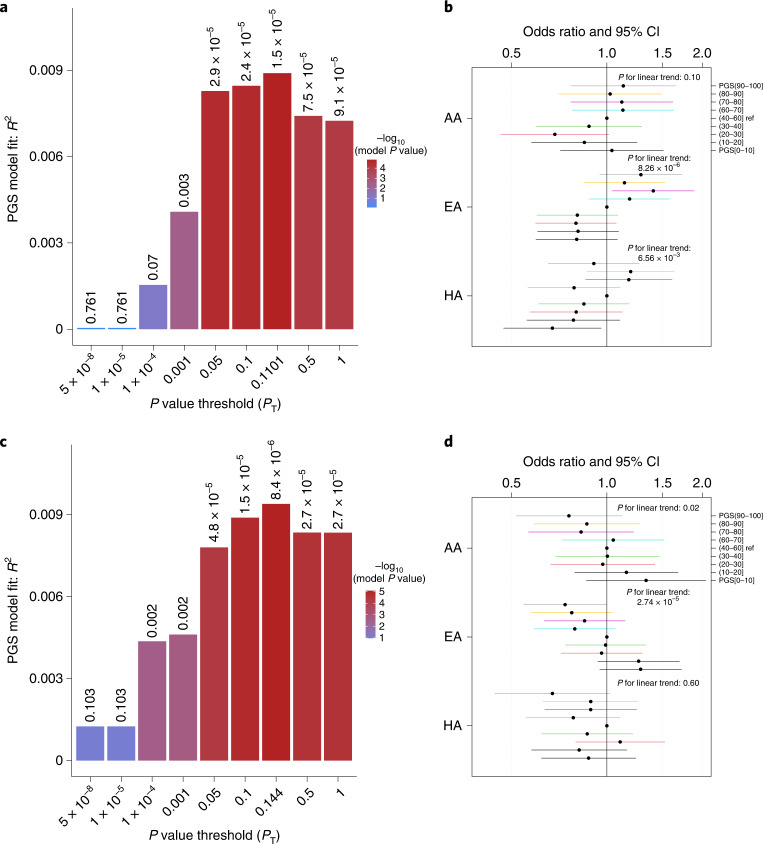
Fig. 3. Validation of associations with MVPA and LST using PGSs in BioMe participants of three ancestries.
a,c, The best performing PGSs for MVPA (a) and LST (c) were derived using logistic/linear regression analyses; that is, those with the highest incremental R2 above and beyond models with only sex, age and the top ten principal components. This was accomplished using inclusion thresholds of P < 0.1101 for MVPA and P < 0.14 for LST. b,d, The association—examined using a logistic regression analysis—of MVPA with the PGSs for MVPA (b) and LST (d) in individuals of African (AA, n = 2,224), European (EA, n = 2,765) and Hispanic (HA, n = 3,206) ancestry in data from the BioMe BioBank. Dots and error bars show OR and 95% CI.

