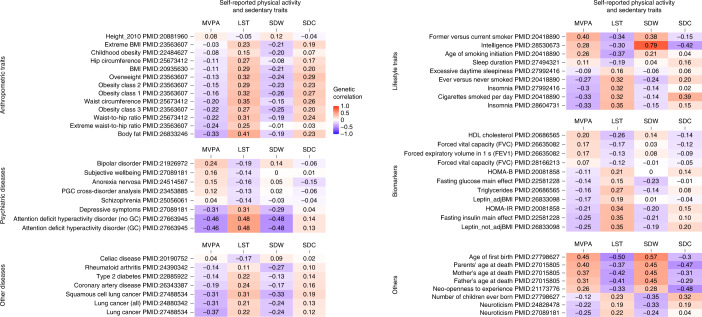
Fig. 4. Genetic correlations of four self-reported physical activity traits with complex traits and diseases.
Results are based on published GWAS with P < 4.6 × 10⁻⁴ for at least one physical activity or sedentary trait. Darker colors reflect higher negative (purple) or positive (red) correlation coefficients. GC, genomic control; HDL, high-density lipoprotein; HOMA-B, homeostasis model assessment of beta-cell function; HOMA-IR, homeostatasis model assessment of insulin resistance; PGC, psychiatric genomics consortium.

