
Extended Data Fig. 1. LST-associated loci are enriched for genes with altered expression in skeletal muscle following resistance training.
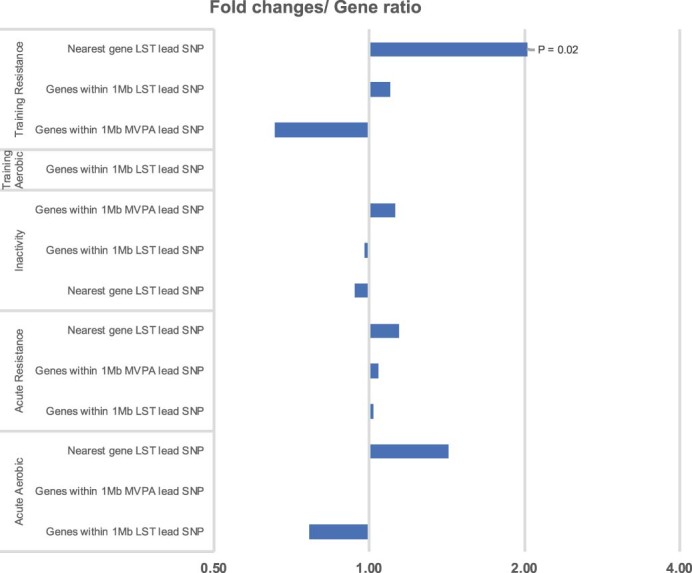
Fold-change plot in log scale for the ratio between: (1) the proportion of genes in physical activity-associated loci that showed an altered expression in skeletal muscle (FDR < 0.01) across five categories: inactivity, acute bout of resistance exercise, acute bout of aerobic exercise, resistance training, or aerobic training; and (2) the proportion of all genes that showed an altered expression following such (in)activity in the MetaMex database (PMID: 31980607). Tested loci were MVPA or LST-associated loci. In a given set of loci, we either considered only the genes nearest to the lead SNP, or all genes within 1 Mb of the lead SNP. Only loci harboring at least five genes with altered gene expression levels after intervention were included in this figure. A one-sided Fisher exact test was used to calculate the P-value for enrichment.