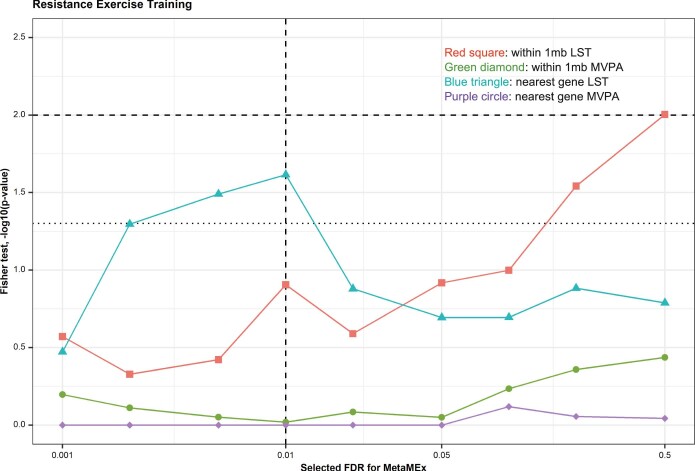
Extended Data Fig. 2. A sensitivity analysis shows the analysis of altered gene expression following resistance training is robust to FDR threshold.
We examined the effect of different FDR thresholds on Fisher’s exact test results for the enrichment analysis of alteration in gene expression in skeletal muscle following resistance training. Red square, genes within 1 Mb of the LST lead SNP; green circle, genes within 1 Mb of the MVPA lead SNP; blue triangle, nearest gene LST lead SNP; purple diamond, nearest gene MVPA lead SNP. The horizonal dotted line indicates nominal significance level (P < 0.05), and the vertical dashed line indicates the FDR threshold that was used. FDR thresholds explored range from 0.001 to 0.5.

