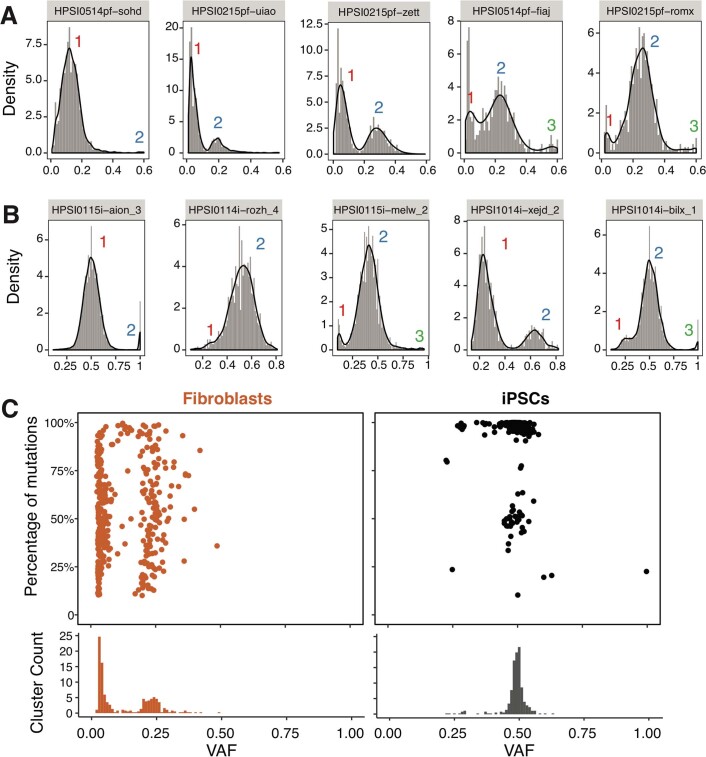
Extended Data Fig. 5. Analysis of Variant Allele Frequency in fibroblasts and iPSCs.
Distribution of Variant Allele Frequency (VAF) distribution of five fibroblasts and five hiPSCs are shown in (A) and (B), respectively. Kernel density estimation was used to smooth the distribution. Local maximums and minimums were calculated to identify subclonal clusters. C, Summary of subclonal clusters in fibroblasts (n = 204) and hiPSCs (n = 324). Each dot represents a cluster which has at least 10% of total mutations in the sample. Most of the fibroblasts are polyclonal with VAF of a cluster of nearly 0.25, whereas hiPSCs are mostly clonal with VAF of nearly 0.5.

