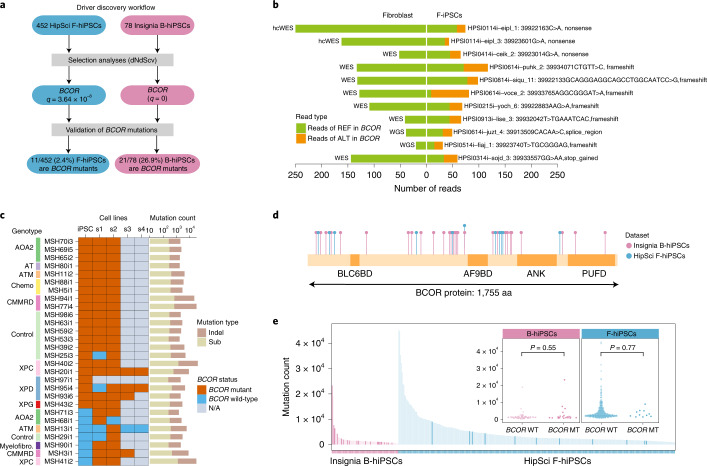
Fig. 4. Selection analysis revealed positive selective forces on BCOR mutations in F-hiPSCs and B-hiPSCs.
a, Driver discovery workflow. Each BCOR mutation was curated using a genome browser. b, Number of reads reporting BCOR mutations in 11 F-hiPSCs and their founding fibroblasts. Colors are indicative of whether the sequencing read contains a mutation or otherwise (green, reads with reference (REF) allele; orange, reads with alternate (ALT) allele). c, BCOR mutation status of Insignia B-hiPSCs. Not shown are 50 of 78 B-hiPSCs that do not carry any BCOR variants in parental hiPSCs or their corresponding subclones. Rows indicate B-hiPSCs derived from various donors, including patients with genetic defects and healthy controls. Columns indicate parental hiPSC (iPSC) and daughter subclones (s1–s4). BCOR mutation status is shown in brown if at least one read contains a BCOR mutation in the sample or blue if there are no reads containing BCOR mutations in that sample. Gray indicates that a sample was not available (N/A). Total count of substitutions and indels of each iPSC is shown in histogram on the right. d, Schematic illustration of positions of mutations in BCOR protein in all F-hiPSCs (blue) and B-hiPSCs (purple). e, Exploring relationship between hiPSC mutation burden and BCOR status (two-sided Mann–Whitney test). hiPSCs with BCOR hits are highlighted with a darker shade of purple (B-hiPSCs) and blue (F-hiPSCs). MT, mutant; WT, wild-type.

