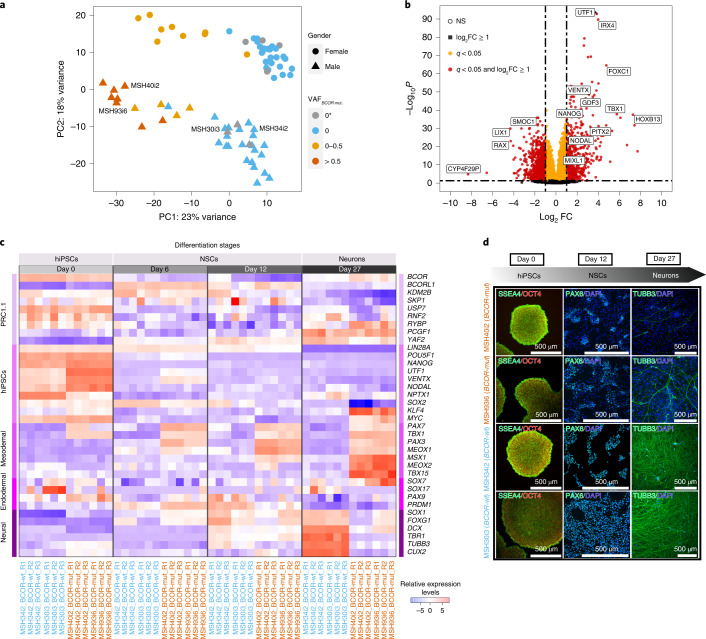
Fig. 5. Functional validation of the impact of BCOR mutations in hiPSCs and their differentiation potential.
a, PC analysis showing hiPSCs distribution based on their transcriptome expression. Transcriptomics changes are correlated with BCOR mutation VAF values. 0* denotes that no BCOR mutations were found in hiPSC parental lines but were seen in their subclones. b, Volcano plot of differential gene expression analysis in hiPSCs with BCOR mutations (BCOR-mut) and no BCOR mutations (BCOR-wt) lines. FC, fold change. c, Heatmap of relative expression levels of members of noncanonical polycomb repressive complex 1.1 (PRC1.1), hiPSCs pluripotency and the three germ layers markers for two BCOR-wt (blue: MSH34i2, MSH30i3) and two BCOR-mut (orange: MSH40i2, MSH93i6) hiPSC lines. d, Immunofluorescence characterization of hiPSCs, neural stem cells (NSCs) and neurons at day 0, day 12 and day 27, respectively. Both BCOR-mut and BCOR-wt hiPSCs have similar undifferentiated morphology and express pluripotency markers OCT4/POU5F1 (red) and SSEA4 (green). BCOR-mut lines undergo inefficient neural induction, as highlighted by a reduced number of NSCs expressing PAX6 (green) at day 12 and a reduced number of neurons marked by TUBB3 (green) at day 27.

