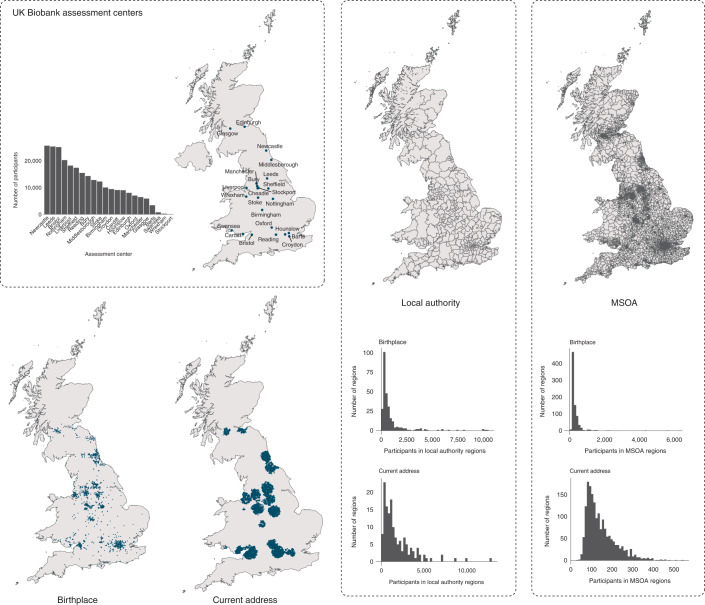
Fig. 2. Assessment centers, local authority and MSOA regions.
The two bottom maps show the locations of birthplace and current address of participants analyzed in the GWASs. Histograms show distributions of these participants across assessment centers and geographic regions for birthplaces and current addresses. All maps and histograms show the same 254,577 UK Biobank participants. Maps were adapted from 2011 Census aggregate data (UK Data Service, February 2017 edition). Office for National Statistics; National Records of Scotland; Northern Ireland Statistics and Research Agency (2017).

