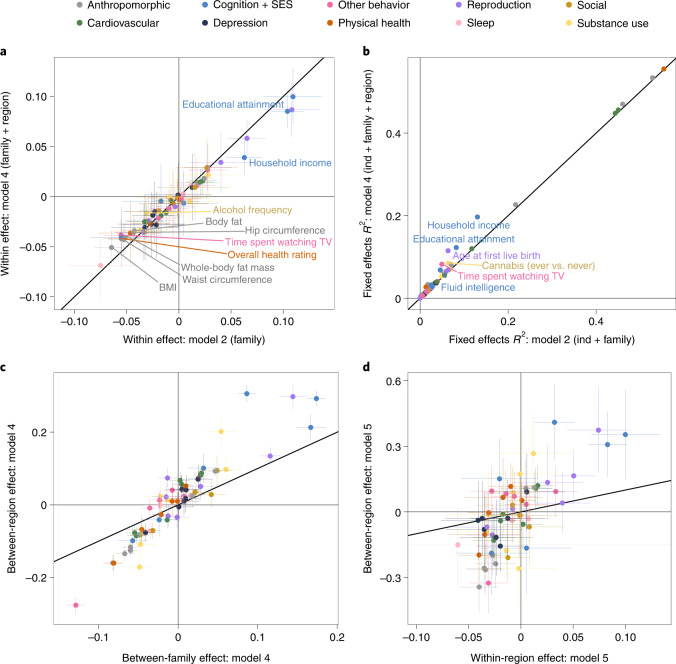
Fig. 3. Results of sibling educational attainment polygenic score analyses for 56 complex traits.
Sample sizes range from 11,093 to 43,516 (see Supplementary Table 1 for sample size per trait). Error bars in a, c and d indicate 95% confidence intervals. a, Comparison of the within-effect estimate of model 2 and the within-effect estimate of model 4. Trait names are shown for the ten traits that showed a significant decrease (p-value of the difference based on 1,000 bootstraps). b, Comparison of the marginal R2 of models 2 and 4 (that is, variance explained by all fixed effects, including age and sex). Trait names are shown for the six traits for which the difference between models 2 and 4 was more than 2%. c, Comparison of the between-family effect and between-region effect estimates of model 4. d, Comparison of the within-region effect and between-region effect estimates of model 5.

