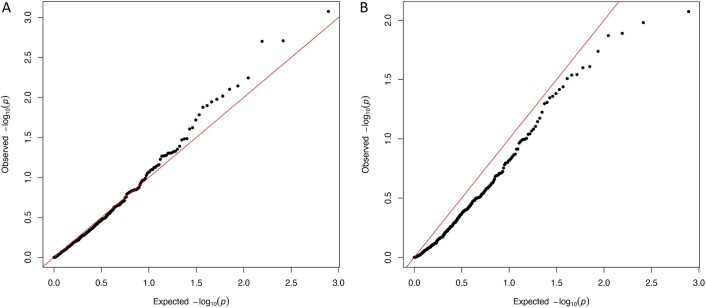
Extended Data Fig. 3. QQ plot showing the ultra-rare synonymous burden test among 404 selected genes between SPARK cases and gnomAD controls for allele frequency<1e-5.
HMCN2 is excluded (not shown) since it has poor coverage in gnomAD. Panel A shows the cross-ancestry case-control ultra-rare synonymous burden comparison, while Panel B shows the European-only case-control ultra-rare synonymous burden comparison. The observed P values for each gene are sorted from largest to smallest and plotted against expected values from a theoretical chi-square distribution.

