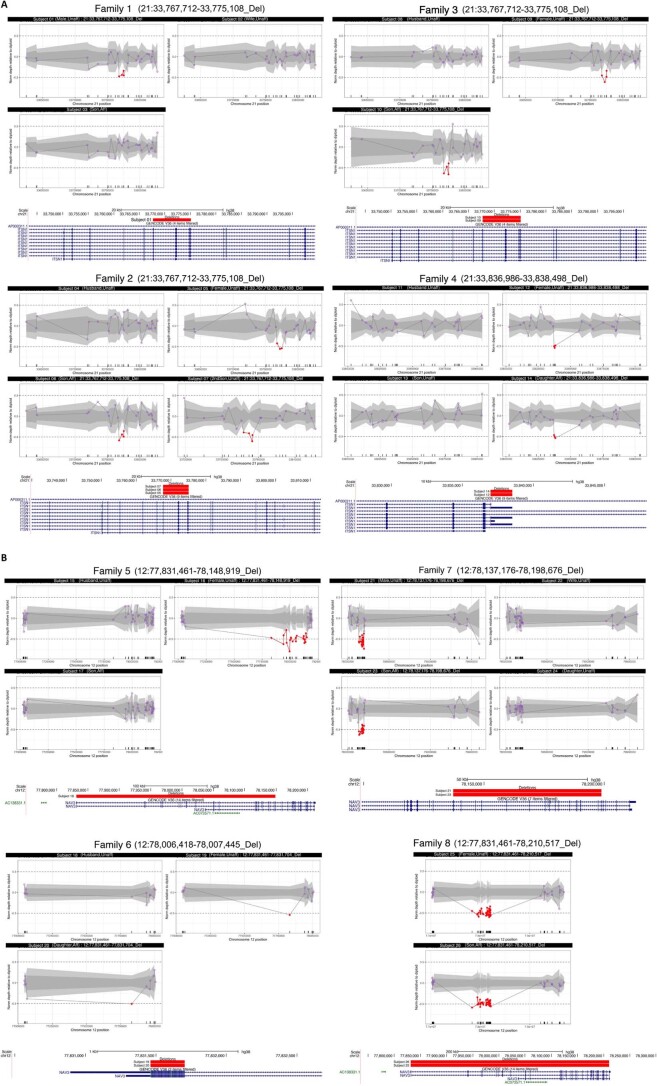
Extended Data Fig. 4. Transmission disequilibrium of exonic or single gene deletions of ITSN1 (A) and NAV3 (B).
The read depth signal plots show normalized read depth (NDP) of exome targets used in CNV calling by CLAMMS84 for ITSN1 (A) and NAV3 (B) in Family 1–8. NDPs of −0.5, 0 and 0.5 correspond to copy number (CN) of 1 (deletion), 2 (normal diploid) and 3 (duplication). NDPs of exon targets within deleted regions are colored red. Dark and gray areas correspond to 1 and 2 estimated standard deviations of NDP for each exon target. CN deletions were initially discovered from all unaffected parents, then subsequently genotyped on Family 1–8. Signal plots of Family 1–8 are shown with parents appear in the top and offspring in the bottom. The deletion regions and affected exons of genes are shown below each plot.

