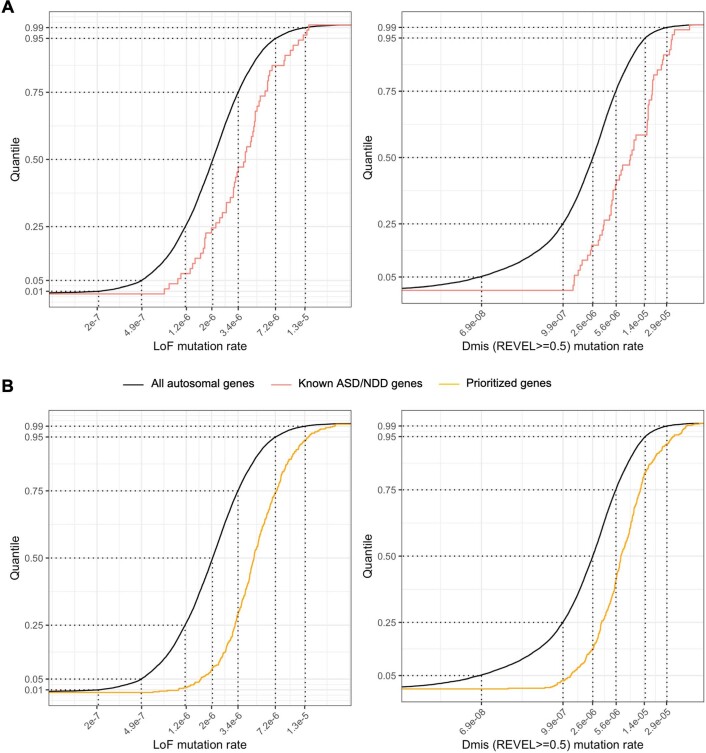
Extended Data Fig. 5. Cumulative distribution of haploid mutation rates (per generation) of LoF and D-mis (REVEL > = 0.5) variants of all protein coding genes on autosomes.
Panel A shows the distribution of all autosomal genes vs. known ASD/NDD genes. Panel B shows all autosomal genes vs. prioritized genes. Baseline mutation rates were calculated using 7mer sequence context dependent mutation rates55. Known ASD/NDD genes tend to have higher mutation rates than average genes.

